How to create effective executive reports: a comprehensive guide
Unlock the secrets to crafting executive reports that make an impact! Dive into our comprehensive guide, where you'll learn essential components, step-by-step creation, and get access to free PowerPoint templates for timelines, Gantt charts, and roadmaps. Elevate your reporting game and help your execs make informed decisions swiftly.
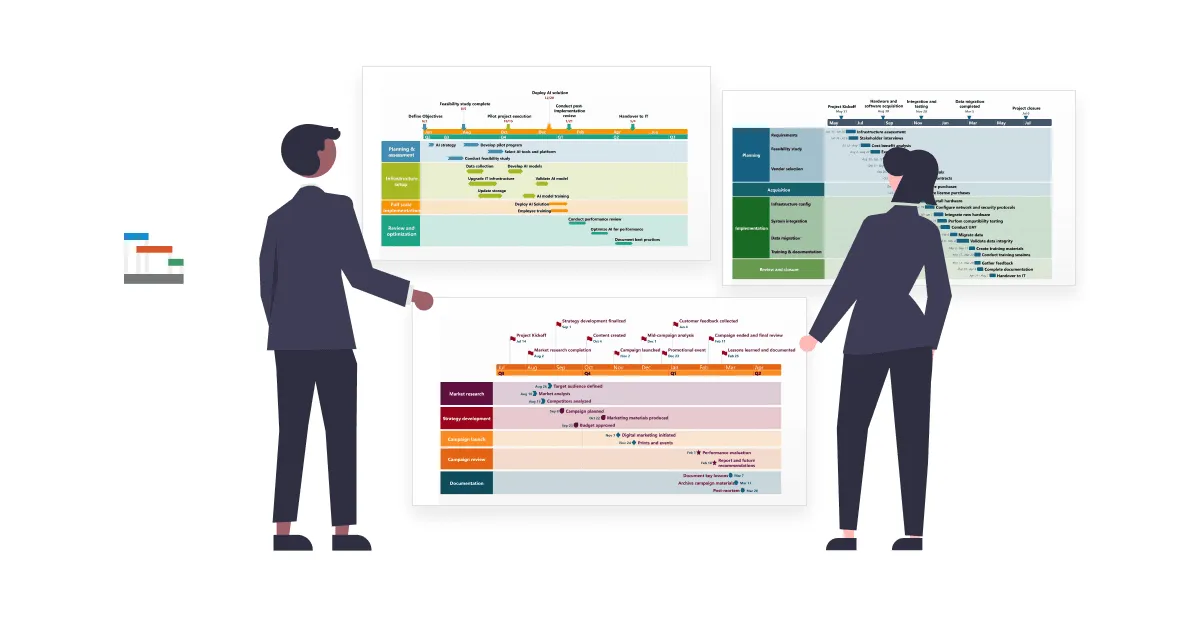
Executive reports are concise, high-level summaries designed to communicate key information to an organization's executives and decision-makers. These reports condense extensive data and complex concepts into an accessible format, enabling executives to make informed decisions quickly. Given their audience, executive reports must be clear, focused, and well-organized.
In our blog post, we'll explore what executive reports are, how to create them, and the key components they should include. We'll also provide examples and free PowerPoint templates, including executive report timelines, Gantt charts, and roadmaps, to help you craft effective reports that communicate crucial information clearly and efficiently.
Understanding executive reports
Let’s start with a brief definition of executive reports.
What are executive reports?
An executive report provides an overview of essential metrics, insights, and recommendations about a specific project, department, or initiative. Unlike detailed technical reports, executive reports emphasize brevity and clarity, highlighting only the most critical information needed for strategic decision-making. They typically accompany an executive summary, which distills the main points of the report into a brief section.
Components of executive reports
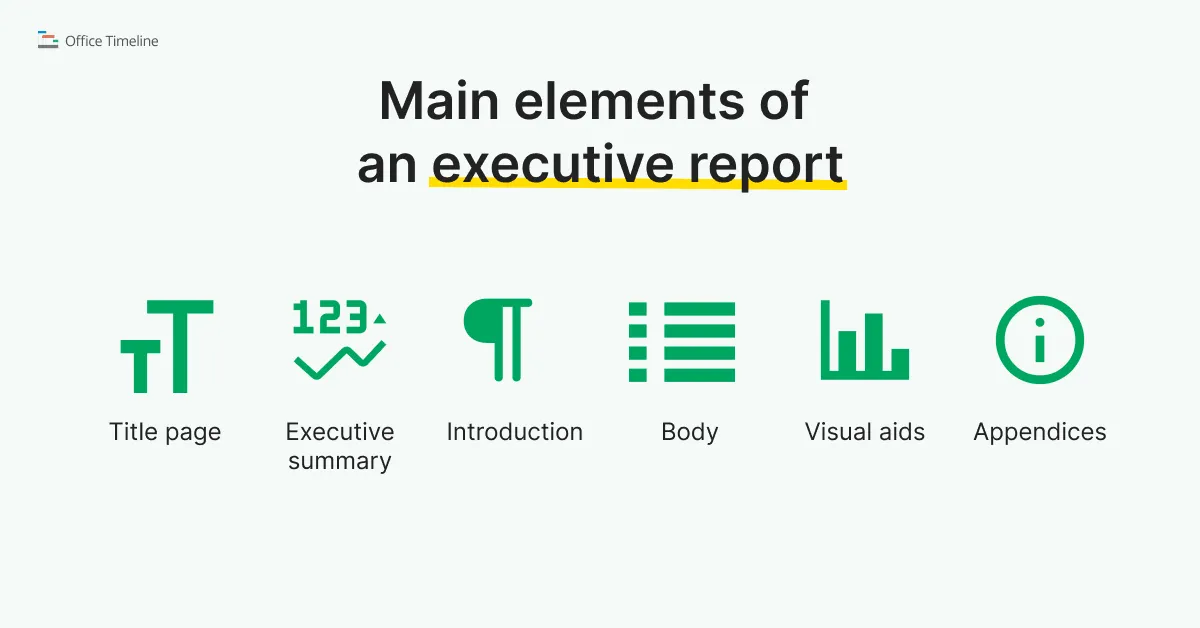
Here are the main elements of an executive report:
Title page
The title page sets the stage for the report. It should include:
- Title: Clearly stating the report's topic.
- Date: When the report was completed.
- Author(s): Who prepared the report.
Executive summary
This is one of most important parts of the report. It should succinctly summarize:
- The purpose of the report;
- Key findings and insights;
- Main recommendations.
Introduction
Provides context by explaining:
- The background of the project or issue;
- The objectives of the report;
- The scope and limitations of the analysis.
Body
This section contains the detailed analysis, broken into subsections as necessary. It should include:
- Key findings: Highlight the most important data points.
- Analysis: Detailed examination and interpretation of the data.
- Recommendations: Practical suggestions for action based on the analysis.
- Conclusion: Summarizes the report and reiterates key recommendations.
Visual aids
Graphs, charts, and tables help to:
- Present data clearly and concisely.
- Highlight key trends and patterns.
- Make complex information more digestible.
Appendices
Include any additional information that supports the report but is too detailed to include in the main body. This might be raw data, detailed methodology, or supplementary project management charts.
How to create executive reports
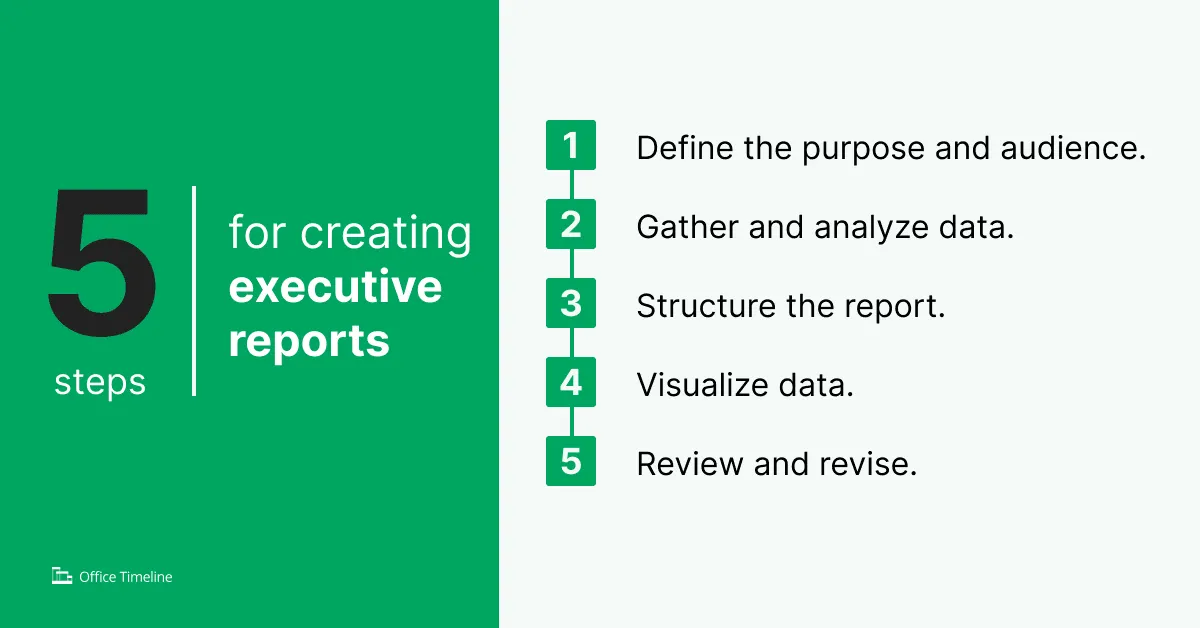
Creating an effective executive report involves several key steps:
1. Define the purpose and audience.
Understanding the primary purpose of the report and the target audience is essential. An executive report should address the specific needs and interests of its readers, usually senior managers or board members. Determine what information is most relevant to them and tailor the report accordingly.
2. Gather and analyze data.
Collect relevant data from reliable sources. This data should be accurate, up-to-date, and pertinent to the report's objectives. Analyze the data to identify key trends, insights, and areas requiring attention.
3. Structure the report.
An executive report typically includes the following components:
- Title page: Includes the report title, date, and the name of the author or team.
- Executive summary: A brief section summarizing the main points of the report. This should be concise, typically one or two paragraphs, and highlight the key findings and recommendations.
- Introduction: Provides context for the report, including background information and the purpose of the report.
- Body: Contains the main content, organized into clear sections with headings. This may include:
- Key findings: Summary of the most critical data and insights.
- Analysis: Detailed examination of the data, including interpretations and implications.
- Recommendations: Actionable suggestions based on the analysis.
- Conclusion: A brief recap of the report's main points and recommendations.
4. Visualize data.
Incorporate charts, graphs, and tables to present data visually. Visual aids can make complex information more understandable and highlight key trends and insights effectively.
5. Review and revise.
Review the report for clarity, coherence, and conciseness. Ensure that the language is clear and free of jargon. Get feedback from colleagues or stakeholders to ensure the report meets its objectives and addresses the needs of the audience.
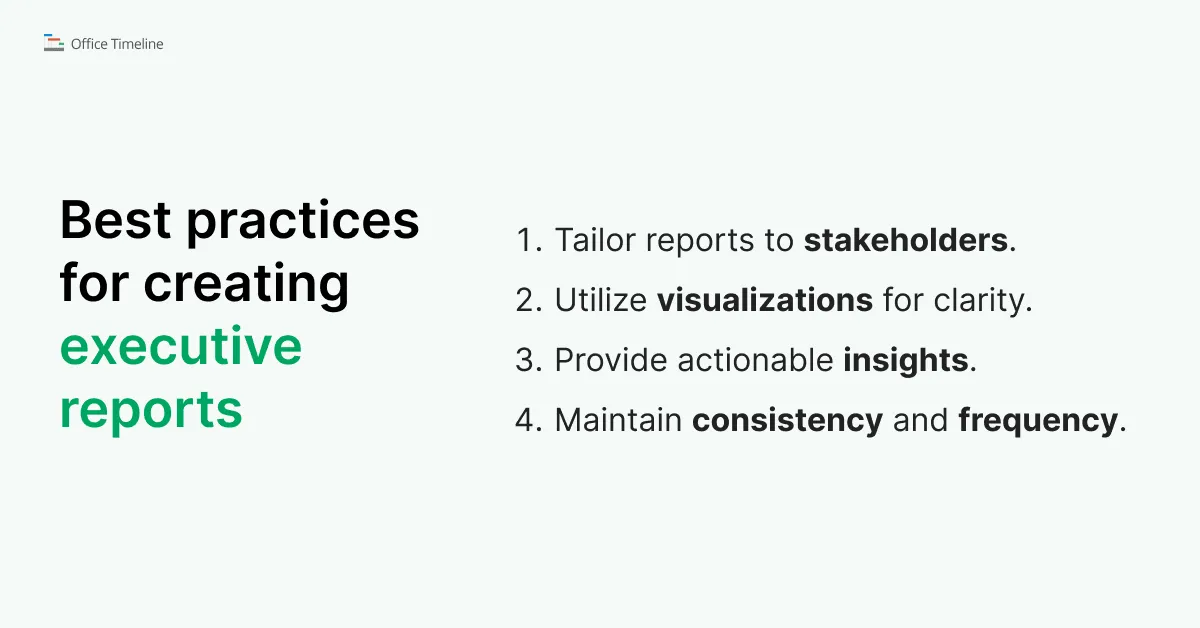
Best practices for creating executive reports
Crafting executive reports that effectively communicate key information requires adherence to best practices that enhance clarity, relevance, and usability.
Tailoring reports to stakeholders
Understand the specific needs and interests of your stakeholders to tailor the report’s content accordingly. Different stakeholders might prioritize different aspects of the report, such as financial status or project milestones.
Utilizing visualizations for clarity
Incorporate charts, graphs, and tables to present data clearly and effectively. Visual aids can help highlight key trends and make complex information more digestible.
Providing actionable insights
Focus on delivering insights that stakeholders can act upon. Recommendations should be clear and directly related to the analysis provided in the report.
Maintaining consistency and frequency
Keep the format and structure of your executive reports consistent to make them easier to read and compare over time. Regular updates are essential to keep stakeholders informed about the project's progress and any changes.
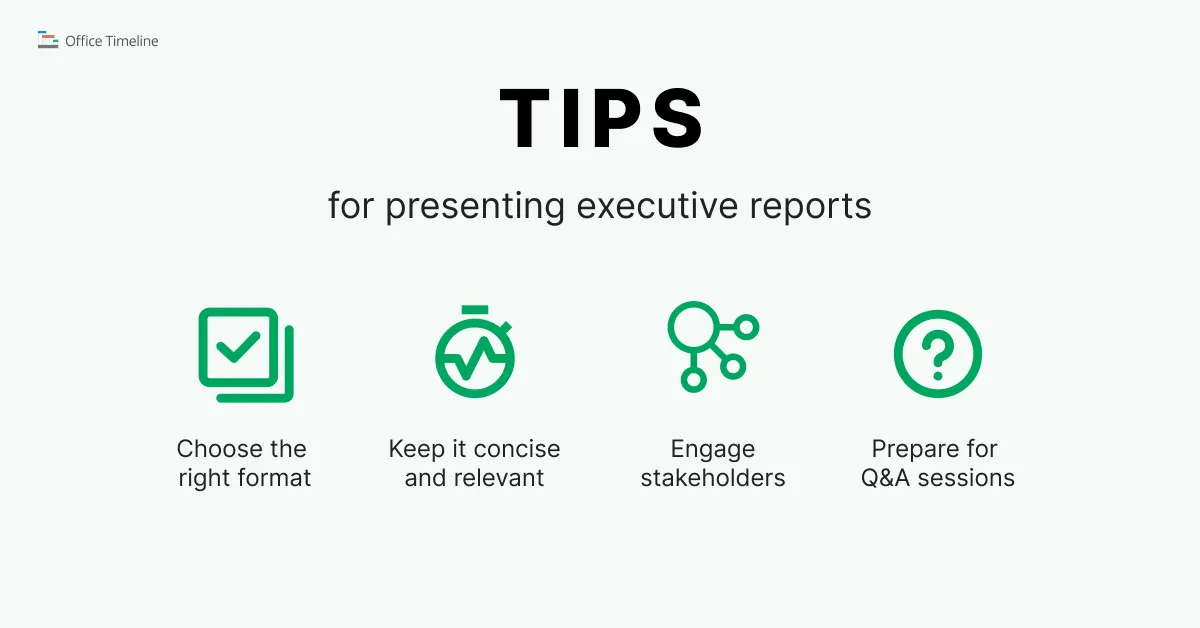
Tips for effective presentation of executive reports
Find below a series of recommendations that help you present executive reports so that your key message is clearly communicated and well-received by stakeholders.
- Choosing the right format
Select a format that suits the report's content and the preferences of your audience. Options include written documents, PowerPoint presentations, or digital dashboards.
- Keeping it concise and relevant
Focus on the most critical information and avoid unnecessary details. A concise report is more likely to be read and understood.
- Engaging stakeholders with visuals, stories, and examples
Use visuals to support your narrative and include real-world examples or stories to illustrate key points. This can make the report more engaging and relatable.
- Preparing for Q&A sessions
Anticipate questions from your audience and be prepared to provide additional details or clarifications. This shows thoroughness and readiness to address concerns.
Downloadable PowerPoint templates
To help you get started, here are some executive report templates tailored to different content pillars:
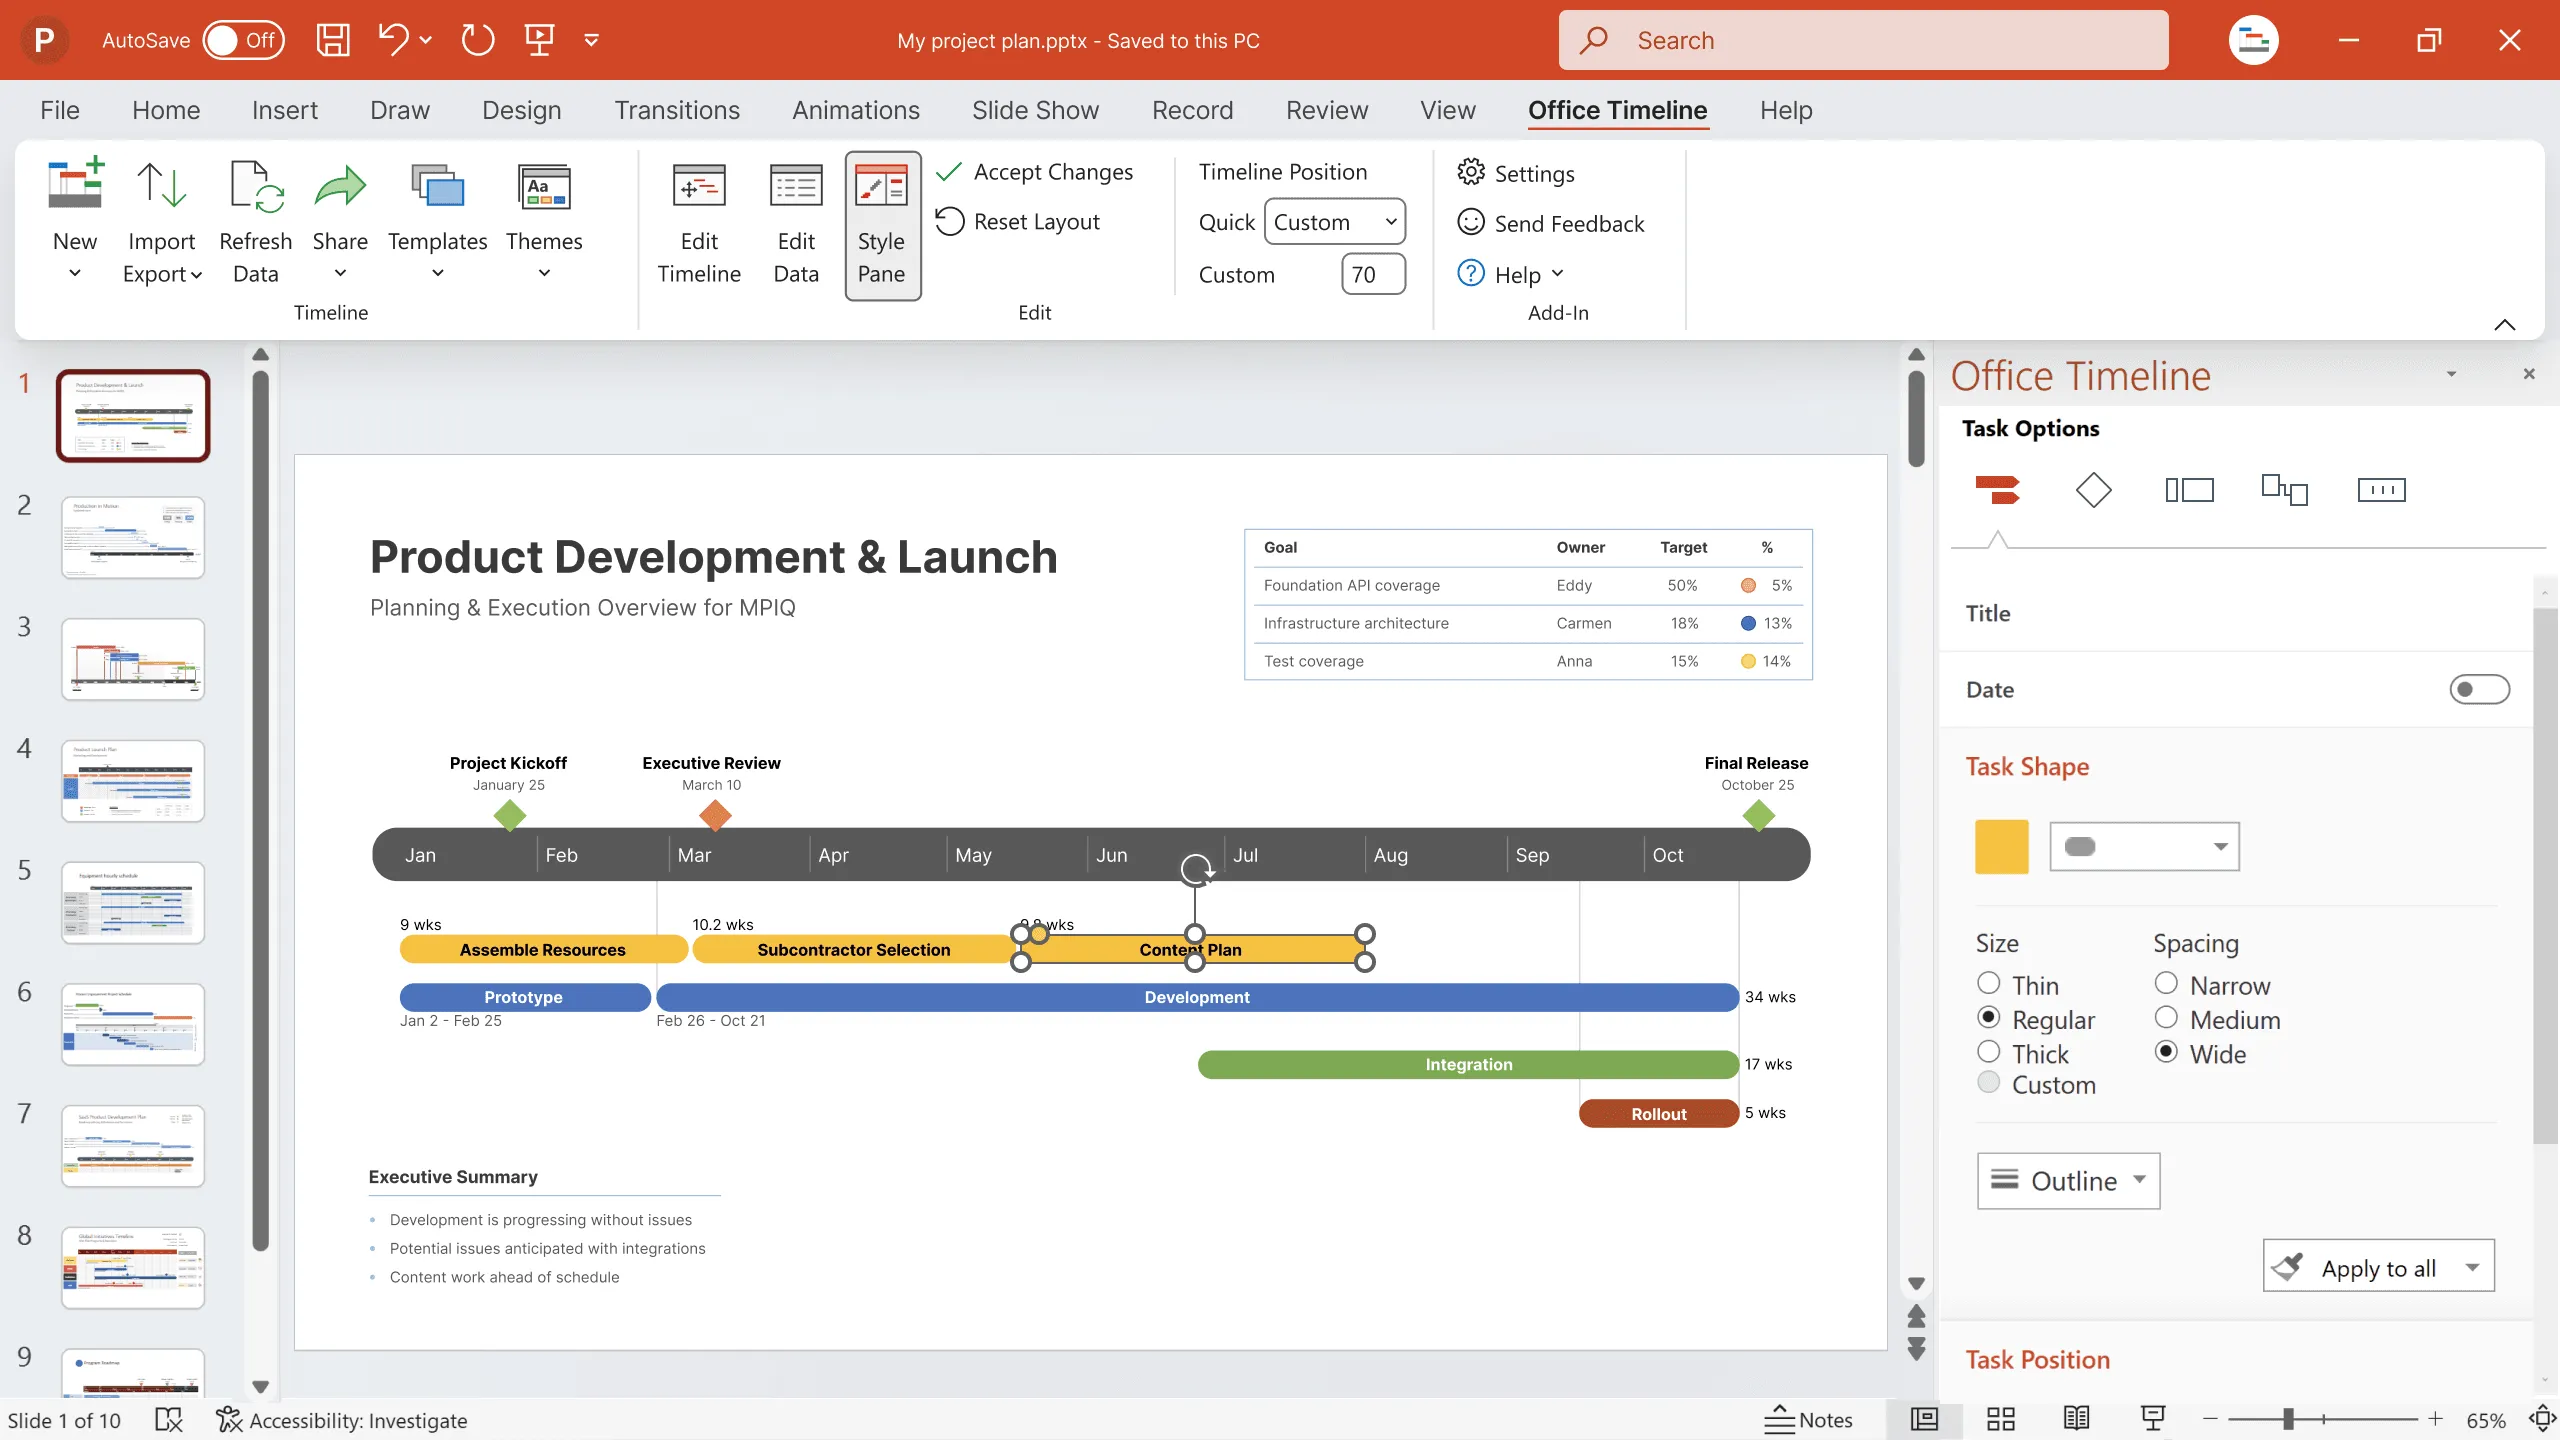
1. Executive report timeline template
This template focuses on project timelines, highlighting key milestones, deadlines, and progress updates.
2. Executive report Gantt chart template
This template includes a Gantt chart to visually represent project schedules and timelines, making it easy to track progress and dependencies.
3. Executive report roadmap template
This template outlines strategic plans and future directions, helping to align organizational goals and initiatives.
Conclusion
Executive reports are vital tools for effective decision-making in any organization. By distilling complex data into a clear, concise format, these reports enable executives to grasp key insights quickly and make informed strategic decisions. Understanding how to create and structure these reports, and utilizing templates for various purposes, can significantly enhance their effectiveness and impact.
FAQs about executive project reports
To help you better understand the nuances of executive reports, we’ve compiled a list of frequently asked questions that address common concerns and provide detailed answers to enhance your knowledge and effectiveness in creating these vital documents.
An executive report is a concise, high-level summary designed to communicate key information to an organization's executives and decision-makers. It condenses extensive data and complex concepts into an accessible format, enabling quick and informed decision-making.
The executive summary provides a brief overview of the report’s main points, including key findings, insights, and recommendations. It allows busy executives to grasp the report’s essence without reading the entire document.
An executive report should be structured to include the following critical information:
- Project overview – it provides a summary of the project, including objectives, scope, and current status.
- Progress update – this uses visual aids such as timelines, Gantt charts, or roadmaps to show the project's progress against key milestones and deadlines.
- Risks and issues – this section identifies any risks or issues that have arisen and outlines the steps being taken to mitigate them.
- Financial status – to summarize the project's budget, including actual vs. planned expenditures and any financial variances.
Key components of an executive report include:
- Title page
- Executive summary
- Introduction
- Body (key findings, analysis, recommendations)
- Visual Aids (charts, graphs, tables)
- Conclusion
- Appendices (if necessary)
An effective executive summary is brief, typically one or two paragraphs, and covers the main points of the report. It comprises the purpose of the report, key findings, and main recommendations.
Common visual aids include charts, graphs, tables, and diagrams. These help to present data clearly and highlight key trends and patterns, making complex information more understandable.
To ensure clarity and conciseness in your executive reports:
- Focus on the most critical information.
- Use clear and simple language.
- Avoid jargon and overly technical terms.
- Use visual aids to present data effectively.
- Review and revise the report to eliminate unnecessary details.
Best practices include:
- Understanding your audience and their needs;
- Defining the report’s purpose clearly;
- Using a logical and organized structure;
- Presenting data visually when possible;
- Keeping the language clear and concise;
- Reviewing and refining the report before submission.
The frequency of updates depends on the context and purpose of the report. For ongoing projects, monthly or quarterly updates might be necessary. For strategic plans or annual reviews, yearly updates might suffice. Always tailor the frequency to the needs of the organization and the report's objectives.
Templates for executive reports, such as timelines, Gantt charts, and roadmaps, can often be found online. These templates help structure your report effectively and ensure you include all necessary components. Some examples include:
Yes, various tools and templates are available online to streamline the creation of executive reports. These include timeline templates, Gantt chart templates, and roadmap templates, which help structure your report effectively.
Project management tips and tricks
Tagged With:
Project reportsTurn project data into professional timelines
Get the advanced features of Office Timeline free for 14 days.
