Visual project management explained
Successful project management depends on clear communication with teams and stakeholders – covering both the big picture and the finer details. When everyone understands how individual tasks and deadlines contribute to the overall initiative, projects run more smoothly and deliver stronger results. Visual project management makes this possible by turning complex plans into visuals that are easy to share, interpret, and act on.
What is visual project management?
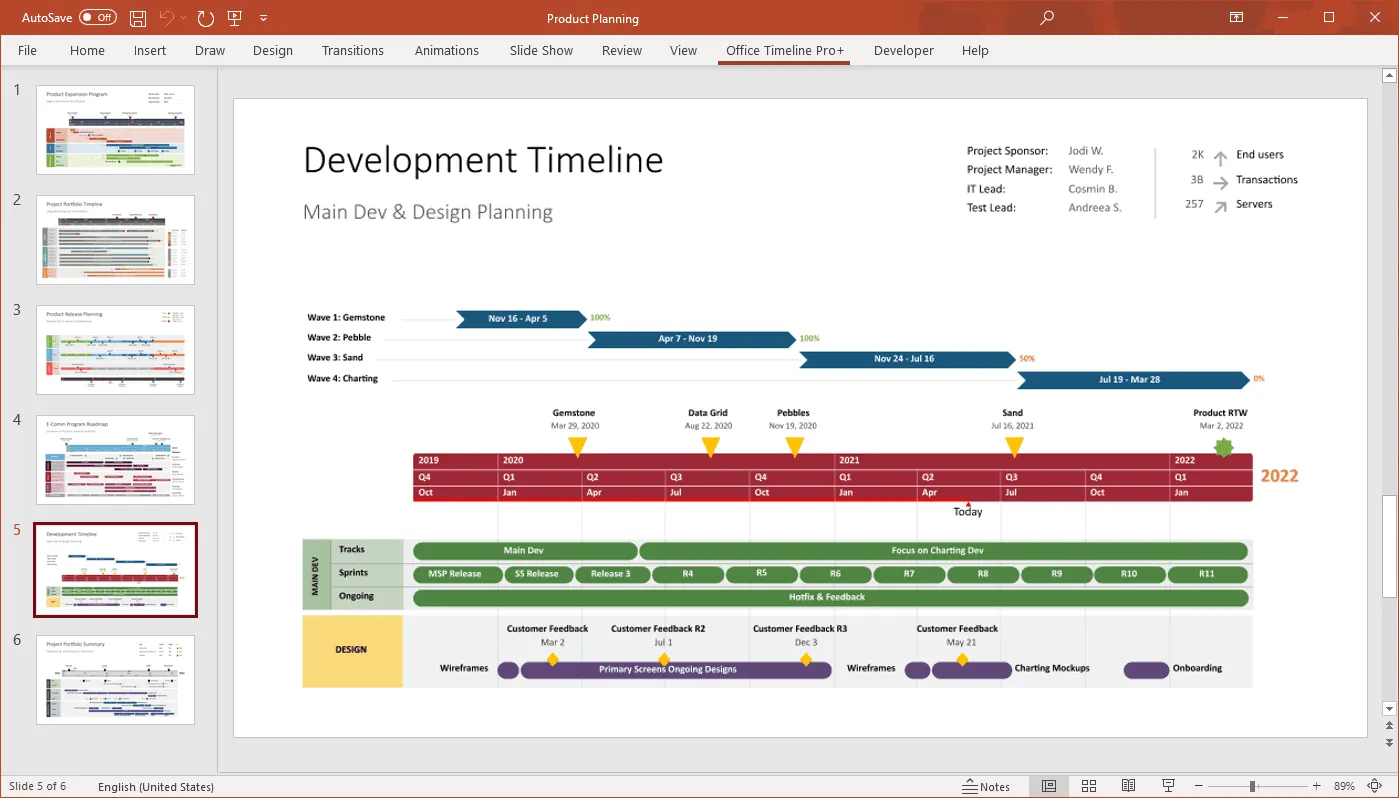
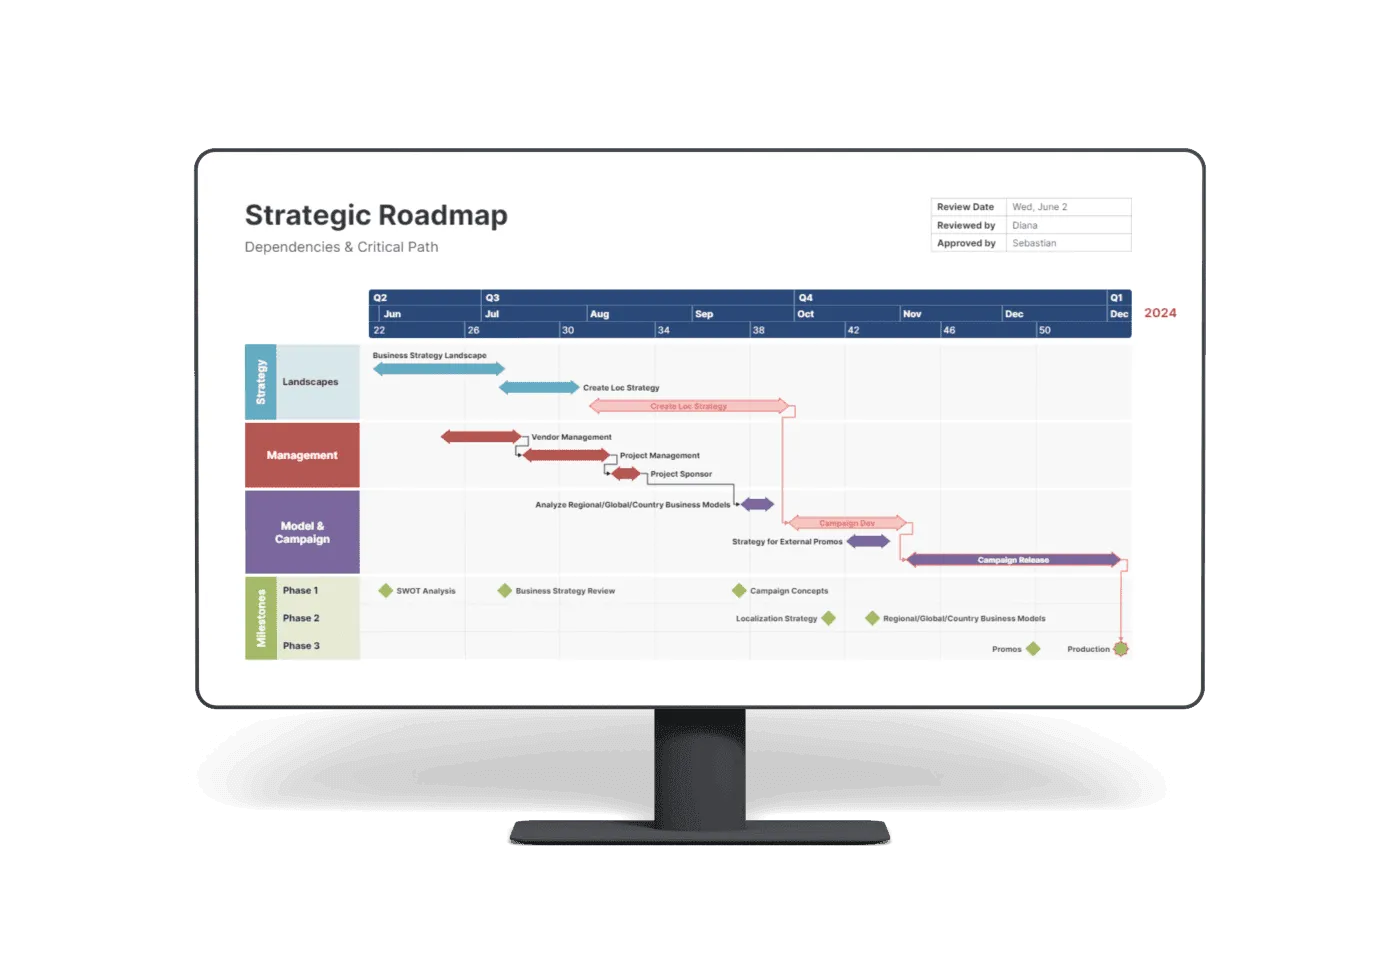
Visual project management represents the method of organizing and managing processes over traditional projects through the use of visual tools such as timelines, Gantt charts, roadmaps and swimlane diagrams. These types of project management graphics help you deliver information in such a way that it can be consumed at a time, place, and manner that is convenient to anyone.
Why is visual project management important?
In today’s fast-paced and lean business culture, representing complex data in an easy-to-understand format and simplifying processes is of essence. At any given time, project managers have to capture, process, and communicate numerous distinct project data points such as task lists, operational expenses, calendars, performance metrics, and many more.
As the speed of business keeps increasing so does the number of data points required to maintain project execution in control. Based on these circumstances, executives need innovative visual project management tools to turn all the complex information into a comprehensible output that will allow them to make efficient long-term decisions. This is why project management has rapidly moved away from heavy-documented, lengthy project status reports and other related artifacts towards data visualization and more agile project management practices.
It is against this background that visual project management has emerged as one of the best ways to manage and lead projects, making voluminous details available under the form of simple, effective communication tools. This, in turn, provides project managers, team members, and key stakeholders with the following key benefits:
- Increased speed and time efficiency – by using clear, easy-to-follow visuals, critical project planning, executing, and tracking activities are conveyed in a single, at-a-glance, digestible view;
- Enhanced clarity, transparency, and understanding of the project’s scope and overall operational plan;
- Improved visibility and allocation of resources across the project;
- Real-time, accurate insights into the project’s scope, plan, priorities, and resource management;
- Optimized communication and collaboration through the clear illustration of processes and workflows.
Project management charts
Project management charts turn complex project data into clear visuals that make planning, tracking, and decision-making more effective.
What are different types of charts?
Within the fast-paced world of project management, data visualization is essential for structuring key activities such as task management, project planning, team collaboration, resource allocation, and progress tracking.
By displaying project information in a clear graphical layout, project management charts help professionals explain, forecast, report on, and organize initiatives. These visuals make data easier to interpret and apply, supporting:
- A high-level overview of project status,
- Real-time progress tracking,
- Early identification of issues, bottlenecks, and risks,
- Data-driven decision making.
Project management charts come in many formats, each with unique advantages that make them suitable for different situations. The most common types include:
- Kanban board
- Gantt chart
- Project timeline
- Roadmap
- Project portfolio
- Dashboard
- Work breakdown structure diagram
Learn more about the format and purpose of each of these project visuals on our dedicated project management charts page.
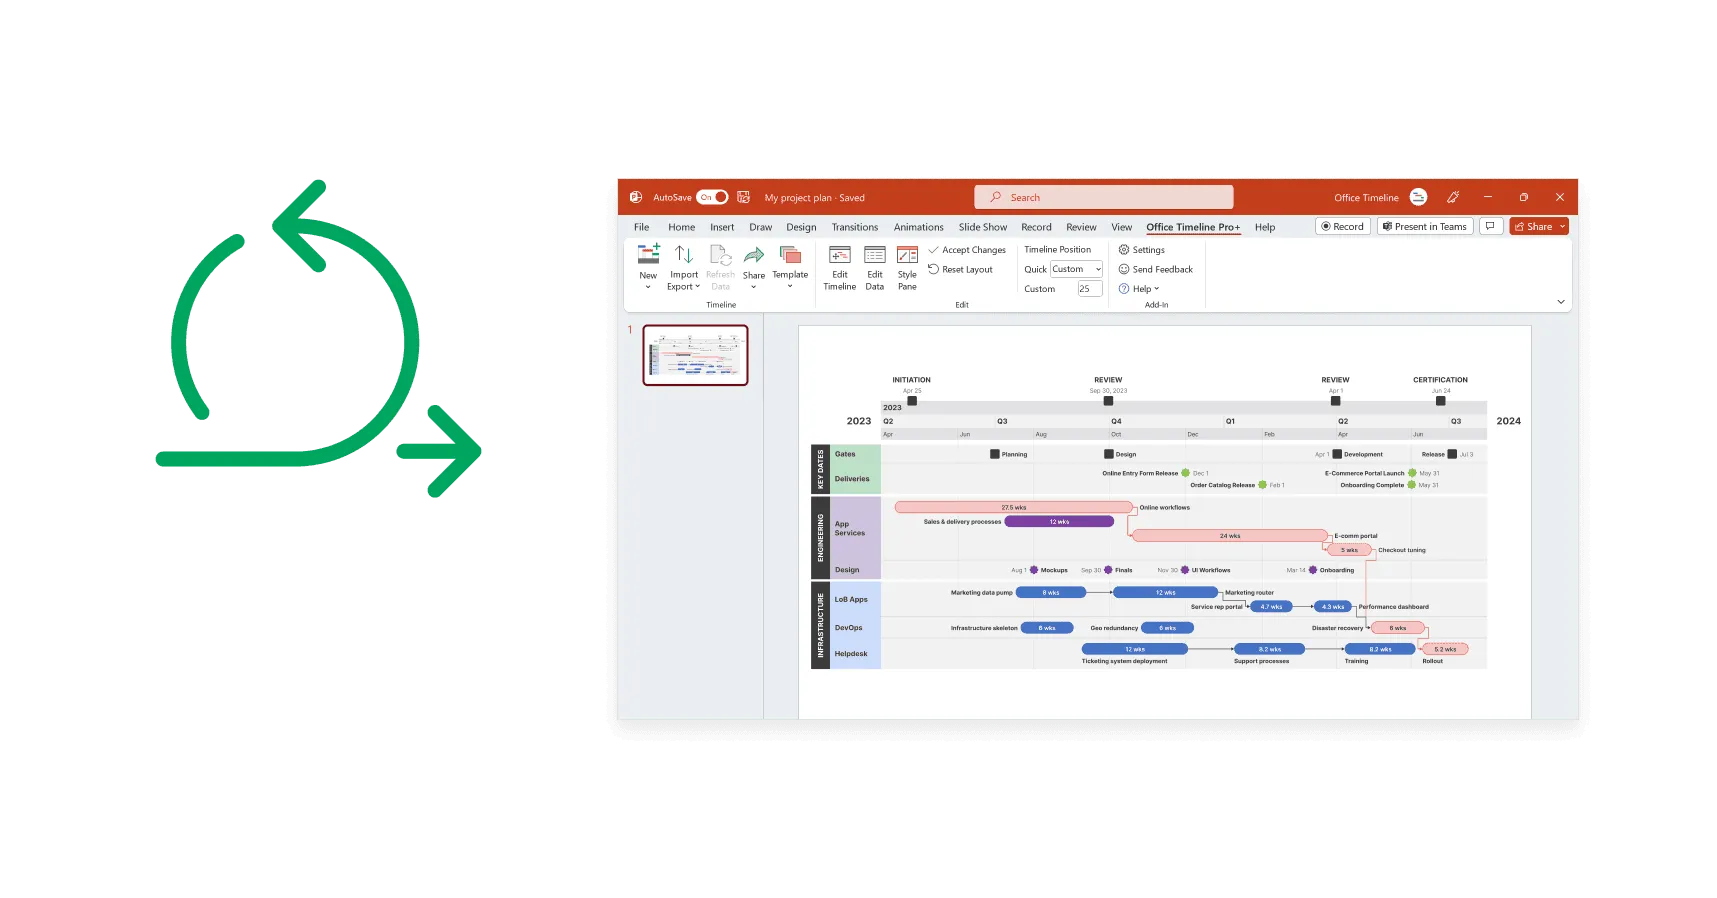
Visual project management tools
Visual project management tools replace static, text-heavy reports with dynamic visuals that simplify planning, improve collaboration, and keep teams aligned.
Why use visual project management tools?
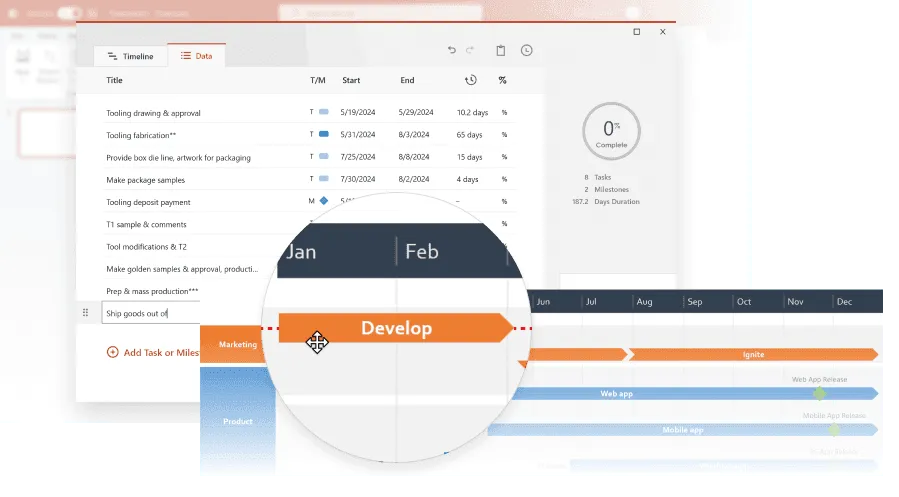
Created as an alternative to text-based project management solutions, visual project management (VPM) tools are designed to help teams visualize processes and workflows. This makes it easier to plan, communicate, and collaborate effectively.
By providing clear visual representations of resources and tasks as a project advances, VPM tools help resolve common challenges such as:
- Breakdowns in communication,
- Bottlenecks and disruptions in workflows,
- Lack of collaboration.
Using visual project management tools allows you to stay organized and make more informed decisions throughout every project phase. They enable you to:
- Communicate and collaborate better – keep everyone informed on who needs to do what and when by sharing project visuals that are easy to understand.
- Efficiently schedule and meet deadlines – identify critical paths, dependencies, and task status at a glance, reducing errors and saving time.
- Reduce work-related stress – streamline the flow of information, monitor tasks more easily, and address bottlenecks without added complexity.
- Optimize processes and workflows – assign and track tasks based on priority, creating a balanced workload and boosting productivity.
Best visual project management tools
The best visual project management tools should be easy to master yet powerful enough to meet the demands of professional project managers. Key features to look for include:
- Familiar interface – drag-and-drop functionality, ready-to-use templates, and intuitive controls for quick adoption.
- Task management – the ability to create, assign, and track activities; set due dates and dependencies; analyze critical paths; and add milestones.
- Collaboration features – file sharing, comments, and @mentions to support team communication.
- Integration – compatibility with other project management systems to ensure flexible and effective data processing.
For more guidance on choosing the right software, see our review of the 8 best visual project management tools on the market.
Agile project management
Agile project management offers a flexible, iterative approach that helps teams adapt quickly and deliver continuous value.
What is Agile project management and who uses it?
Agile project management is a customer-centric method of planning and executing projects, built around continuous improvement and responsiveness to change. Instead of rigid plans, Agile breaks work into short cycles called sprints. At the end of each sprint, progress is reviewed, feedback is gathered, and improvements are applied to the next cycle.
This iterative system allows teams to adapt quickly to evolving requirements, emerging technologies, and shifting customer preferences. The result: deliverables that remain relevant and valuable throughout the project’s lifecycle.
Originally developed for software development, Agile has since expanded into many industries as a popular alternative to milestone-driven project methods. Today, sectors such as financial services, IT, human resources, and marketing use Agile practices to improve efficiency, collaboration, and outcomes.
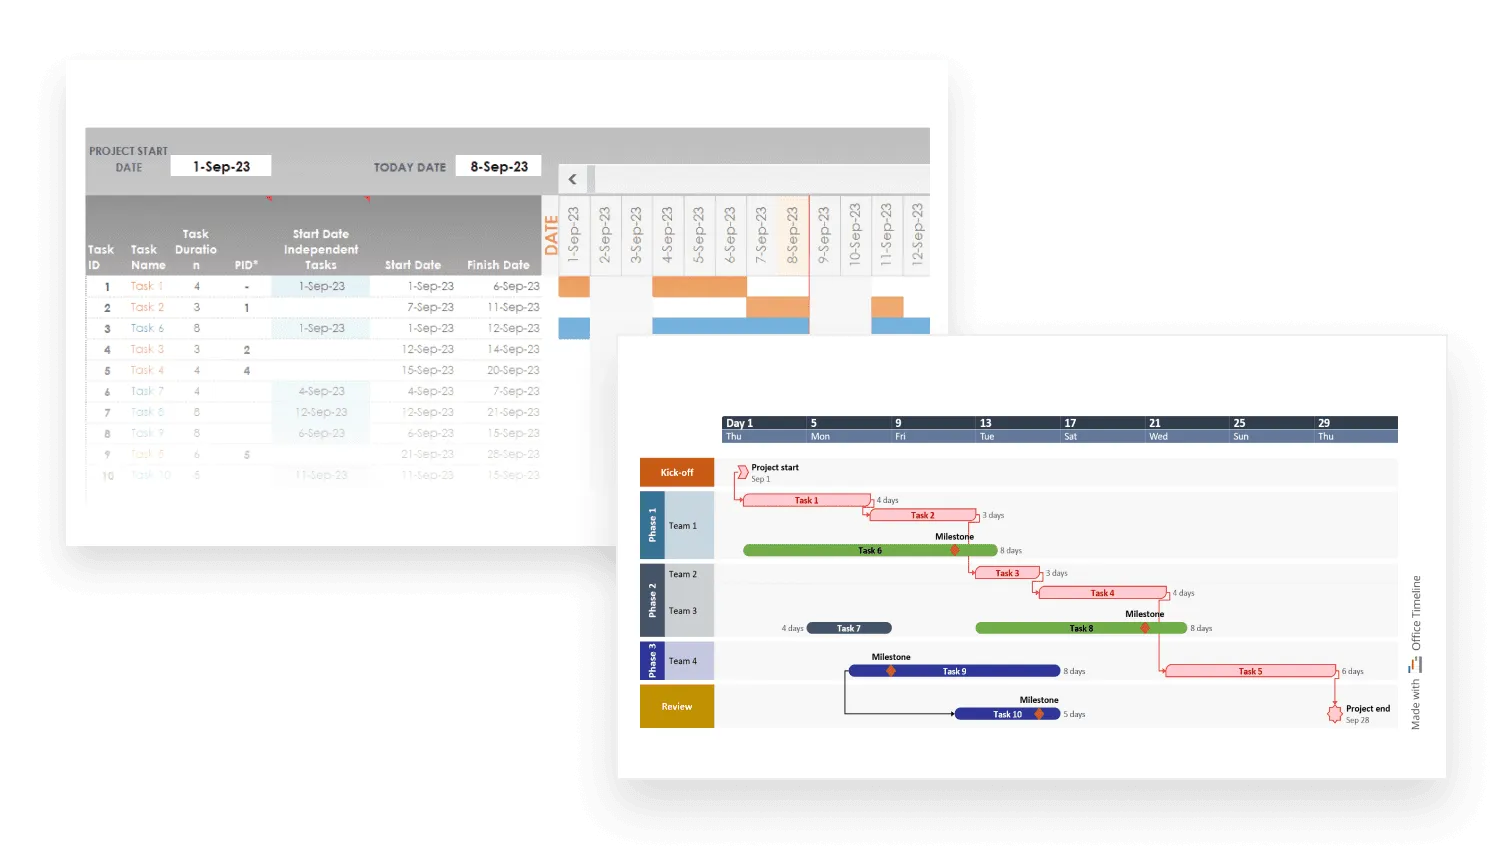
Project management in Excel
Although not marketed as a project management solution, Microsoft Excel is widely used for project tracking. While it doesn’t cover every project management need, it offers a few powerful functions that can support planning and monitoring activities.
When to use Excel for project management
Modern project management often relies on advanced data visualization, making Excel seem like an unlikely choice. Still, in many cases it’s a practical, budget-friendly option:
- You work alone or in a small team – entrepreneurs and small contractors rarely need feature-heavy platforms aimed at large enterprises.
- You want simple outputs – unlike dedicated PM tools with a learning curve, Excel provides an easy way to structure and highlight task lists, due dates, and resources.
- You need to save money – visual project management software can be costly over time, while Excel offers a low-cost alternative if it meets your tracking needs.
Best use cases for Excel project management
Even without advanced visualization, Excel has functions and templates that make it helpful for core project management tasks such as:
- Timelines – create a simple timeline chart to outline project phases and schedules.
- Project budgets – use Excel’s number-crunching power to track income and expenses for small to mid-sized projects.
- Task lists – build straightforward to-do lists with task descriptions, resources, and assignments.
Learn more about how Excel can support your project planning and explore a range of customizable Excel templates on our project management in Excel page.
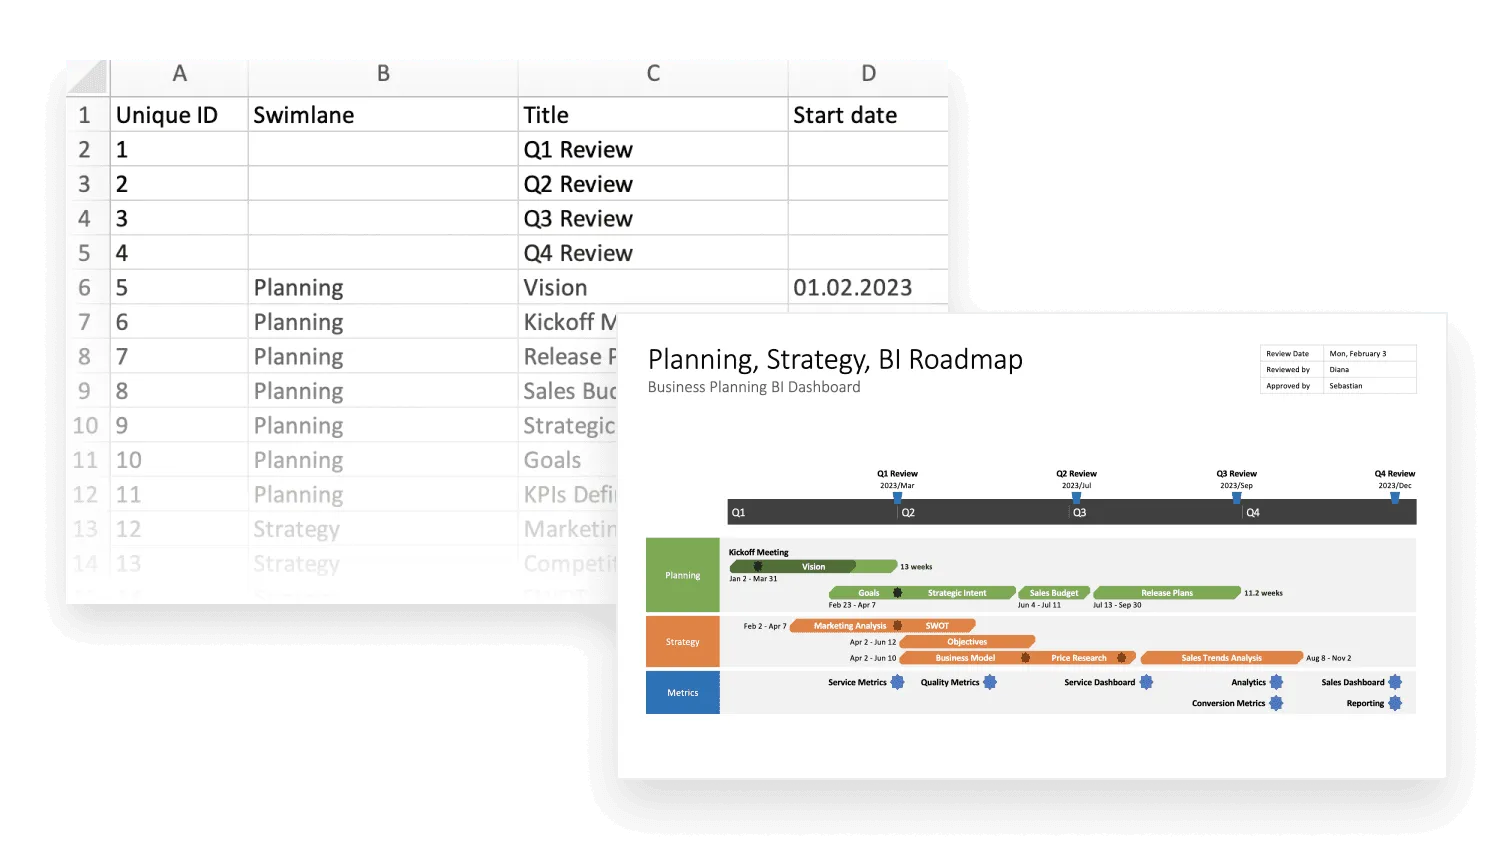
Visual project management templates
Governed by the imperative of time efficiency, planning and managing any business initiative will always benefit from using visual project management templates. Providing a reusable, pre-formatted project outline that you can populate with your own data, PM templates serve as a great starting point for new work, saving you time and efforts when setting up:
- tasks,
- dependencies,
- timelines,
- assignees,
- workflows.
There are a variety of visual project management templates available, some of which come right inside well-known productivity tools such as Microsoft Project or Excel. However, the best project management templates that you can use are the customizable ones. Unlike most standard pre-built samples, where you need to modify the generic structure to include your company information and other specific details whenever creating a new project plan, a customizable template enables you to simply adjust the layout and placeholder data to suit your particular project’s needs and save it for future use.
Now it is essential to choose a customizable visual project management template that is flexible enough to support different requirements and work styles. This will not only allow users to produce individual views that highlight the information each of them finds relevant, but also ensure that everyone starts with a common basis for structuring critical data.
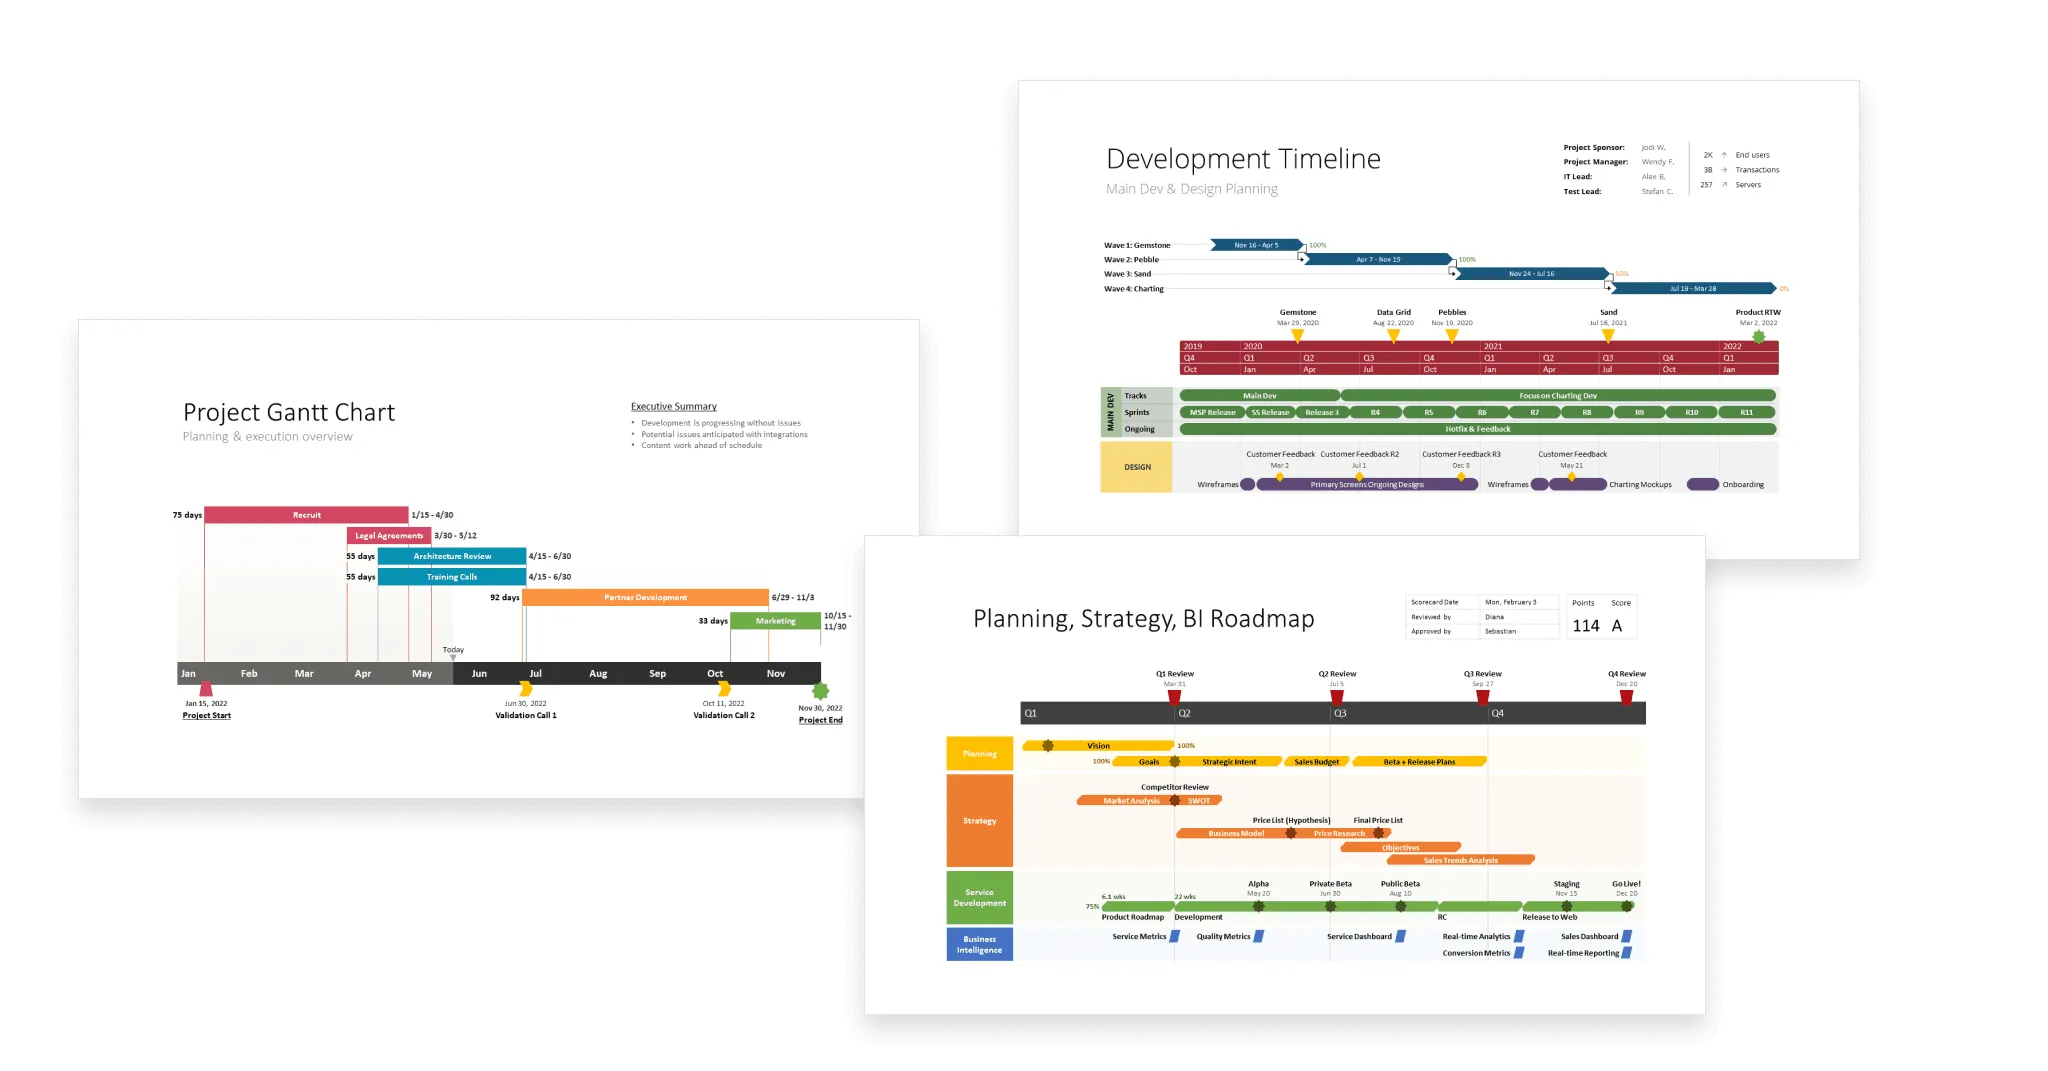
To help you kick off your project, effectively align goals and priorities with team members and stakeholders, and successfully set up a formal model to keep recurring work consistent, we have put together a collection of professionally designed visual project management templates that you can easily customize.
Excel and PowerPoint templates for project management
Visit our project management templates page to get access to more free, customizable templates that help you effectively visualize and organize your project plans. You can explore and download the most common Project Management templates as Excel and PowerPoint files, such as:
FAQs about project management
In this section, we provide the answers to the most common questions about visual project management.
Visual project management is the practice of using illustrations and diagrams to represent complex data or to simplify processes, so it is easier for businesses and their employees to plan, execute and control projects.
Using visuals in project management is important because it helps convey complex data in an easy-to-understand format and streamlines project information flow among concerned parties. This, in turn, ensures:
- visibility, clarity, and transparency around the project’s scope and underlying processes;
- time efficiency in making essential project details accessible to everyone;
- better understanding of what needs to be done, project progress, potential roadblocks, and risks;
- increased team productivity and enhanced collaboration.
Here are three of the most popular ways in which you can visually organize your project:
- Timelines or Gantt charts.
- Kanban boards.
- Project dashboards.
Each of these project management chart types has its own pros and cons, and deciding which one works best for you depends on the nature of your project. Regardless of your choice, you can maximize their value by using visual project management software so you can make them completely customizable and automated.
A visual representation of a project is any illustration of the tasks and objectives involved in the respective initiative. These graphical representations are called project management charts and their format can range from timelines and Gantt charts to Kanban boards, roadmaps, swimlane charts, and many others.
In project management, data visualization is the technique of converting complex project information into a visual or graphical representation that makes it easier to understand, process, analyze, and communicate.
To try out various visualization formats for your project data, see our collection of visual project management templates that you can easily download and customize.