In our increasingly complex and fast-paced economic landscape, the greatest barriers in communication are information overload and competing priorities. Clarity and brevity are invaluable commodities, yet they are often in short supply. So what can we do to optimize communication with our decision-makers and help them make informed judgments that drive organizational growth? The first step is identifying the right instruments for the job.
One of the most effective project management tools for succinct communication that’s able to distill intricate sets of data into clear and actionable insights is the executive report summary. Next, we will cover the basics of compiling this business document and provide you with an executive summary Gantt chart template that will help you jumpstart the process.
What is an executive report summary?
We can think of an executive report summary (or simply executive report, for short) as a high-level document that encompasses all the critical business information that stakeholders need, in a condensed and easily comprehensible form. When you’re creating an executive summary, you should always consider whether this standalone report is sufficient to paint the whole picture of your initiative or if additional information is required; if it’s the latter, you’ll need to go back to the drawing board.
Creating an executive summary report – is it mandatory?
To better understand the utility of writing a compelling executive summary, think about the viewership it’s aimed at. More often than not, this audience consists of decision-makers with a lot of work but very little time on their hands and wildly varying degrees of technical knowledge.
Therefore, while you could technically send over a business proposal or a strategic plan, it’s unlikely they will have the time or patience to read through dozens of pages of detailed information. Conversely, a brief and to-the-point executive report complete with intuitive visuals could help you get your foot in the door. There’s no need to cover all the nitty-gritty details to get the point across from the get-go. Just get your audience interested enough, and you might get a meeting where you can share the full story.
The standard executive summary format
Formatting an executive summary report properly depends on the purpose of the document (i.e., if it is a business case, an executive project status report, a research document, a project proposal, etc.). Nonetheless, this type of brief aims to highlight an issue and drive action, so it generally comprises four chapters:
- Defining the issue or need that must be addressed;
- Outlining the solution that you are proposing;
- Clarifying the value of the solution and the predicted outcomes;
- Concluding with a summary of the business plan covering all previously discussed points.
Formatting an executive summary should take into account the context, its purpose, and the audience it is directed at, but will typically follow the sections above. Quite often, the executive report will be accompanied by supporting visuals, like a Gantt chart, timeline or roadmap, depending on the data relevant for the presentation.
Writing an executive report
As with most business documents, taking a structured approach to writing an executive report is key to its success. We have previously covered the key sections, so let’s delve into the steps you can take to ensure it goes as smoothly as possible and maximize its impact:
- Read the entire documentation that will be summarized in the executive report.
- Identify key findings, project goals, and recommendations.
- Learn about the audience (knowledge, priorities, areas of interest, concerns, etc.) in order to customize your pitch accordingly.
- Write an outline or a bullet list table of contents to ensure your executive report has a coherent and comprehensive logical flow.
- Craft a catchy and impactful opening statement to captivate and involve your viewers.
- Set the stage with a brief description of the objectives and methodology you plan to use.
- Highlight the key findings and results, focusing on the ones most relevant to your audience.
- Give an overview of your recommended actions, ensuring they are realistic and in line with the highlighted objectives.
- Add formatting (paragraphs, headings, bullet points) to improve readability.
- Include supporting visuals, graphs, and charts.
- Review the executive report summary draft for brevity and clarity.
There are also numerous executive summary examples online that you can draw inspiration from, whether you’re writing it as an executive project status report, a high-level project update, or business proposal.
Benefits of using an executive report Gantt chart template
Combining Gantt charts with executive report summaries is a powerful way to convey complex information clearly and efficiently. The visual representation of milestones and tasks simplifies your timeline, allowing your audience to grasp the project's schedule without lengthy explanations.
Using a Gantt chart enhances planning and coordination among teams and stakeholders, ensuring everyone is on the same page. It also promotes fair resource allocation and accountability, making it easier to track progress and identify potential bottlenecks.
To help you leverage these benefits, we offer a free, customizable executive report Gantt chart template available for download.
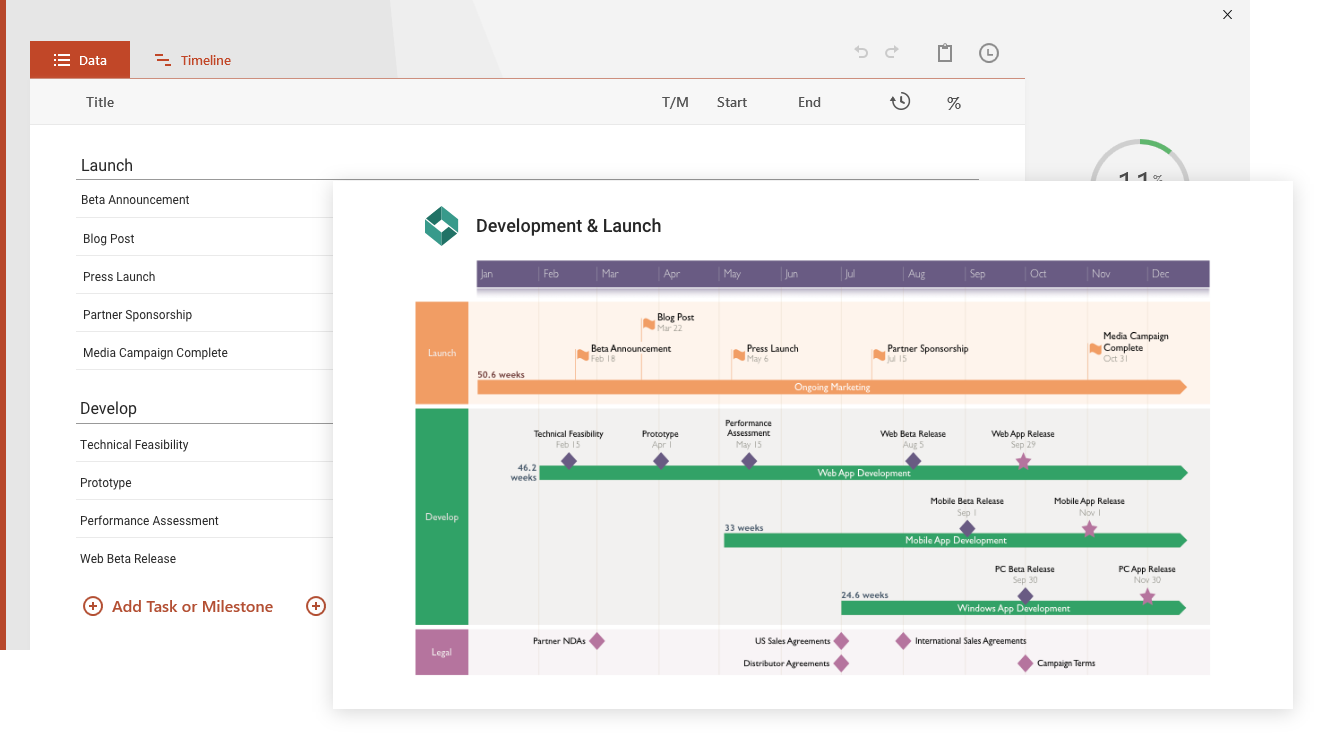
About our executive report Gantt chart template
The executive report Gantt chart template is designed to work seamlessly with the Office Timeline Gantt tool for PowerPoint. This desktop add-in automatically creates and updates Gantt charts and integrates effortlessly with project management software like Microsoft Project and others. This means you can quickly import your existing data and instantly transform it into a polished PowerPoint Gantt chart that can be easily revised to keep your stakeholders updated.
By utilizing tools like Gantt charts and focusing on clarity and brevity, you can craft impactful executive report summaries that highlight key issues, propose solutions, and outline implementation strategies. This approach not only captures the attention of busy stakeholders but also facilitates informed decision-making, driving organizational growth and success.
Frequently asked questions about executive reports
Let’s answer some of the most common questions about executive report summaries.
What is an executive report summary?
Exec summaries, often called simply executive reports, are concise, high-level documents that present all the essential business information that stakeholders need in an easily comprehensible format.
Why is executive report writing important?
The executive report is aimed at busy stakeholders who often don’t have the time to read through extensive documents detailing a business proposal. By condensing all the key points into a 2-page summary, you are enabling them to make informed decisions without having to read through extensive documents
What are the 5 main components of the standard executive summary format?
The executive report typically comprises of the following sections:
- Introduction: briefly presenting the proposal, defining the scope, purpose and some contextual information;
- Problem /opportunity statement: clarifying the issue or the potential prospects and highlighting their significance;
- Present potential solutions: summarizing the recommended actions, presenting the strategies and emphasizing on the expected positive outcomes;
- Implementation strategy: breaking down the plan into stages, creating a timeline and critical path and offering an overview of resources necessary for accomplishing the goal;
- Conclusions: recapping the main points, reinforcing the significance of the proposal and adding the call to action.
What is the difference between an executive summary and an abstract?
Executive report summaries could appear similar to abstracts, in the sense that both types of documents condense the information and eliminate superfluous details. However, the key difference between the two lies in their intended purpose:
- Abstracts are centered around the content of a paper, focusing on the methodology employed, scope of the research, and findings uncovered;
- Executive summaries are more comprehensive and written around the actionable insights and recommendations that stem from the content of the original documentation.
How can you handle conflicting viewpoints among your stakeholders?
Accurate, data-driven exec reports that credit their sources and represent key findings truthfully are hard to argue with. However, the same data sets can have multiple interpretations, according to the viewpoints of your stakeholders. It’s always a good idea to acknowledge these perspectives, address existing concerns, and make balanced recommendations that account for them.