Using timelines for collaborative planning in finance
Enhance financial planning collaboration and communication with visual timelines. See how timelines can simplify complex data and improve decision-making.

Ever tried explaining a complex financial project using just a spreadsheet? It’s like going through a maze in the dark. Everyone’s looking at rows and columns, trying to piece together the big picture. Frustrating, right?
Spreadsheets are fine for holding data, but they fall short when it comes to showing what that data really means, especially in financial projects. Take project timelines, for example: a spreadsheet can list dates, but it’s tough to quickly grasp the connections. You need visuals to see dependencies and catch potential roadblocks.
Same with financial planning: spreadsheets can store budgets, but they’re not ideal for modeling different scenarios or tracking spending. For that “what-if” analysis, you need dedicated tools.
And when presenting to stakeholders, a messy spreadsheet is a liability. You need clear visuals and concise reports so everyone understands the plan - from the project team to the C-suite. Not only does this clarity build consensus and buy-in, but a lack of it leads to missed opportunities and costly errors – especially when we think of misunderstandings about deadlines or budget allocations.
How do visual timelines improve financial planning? Practical examples
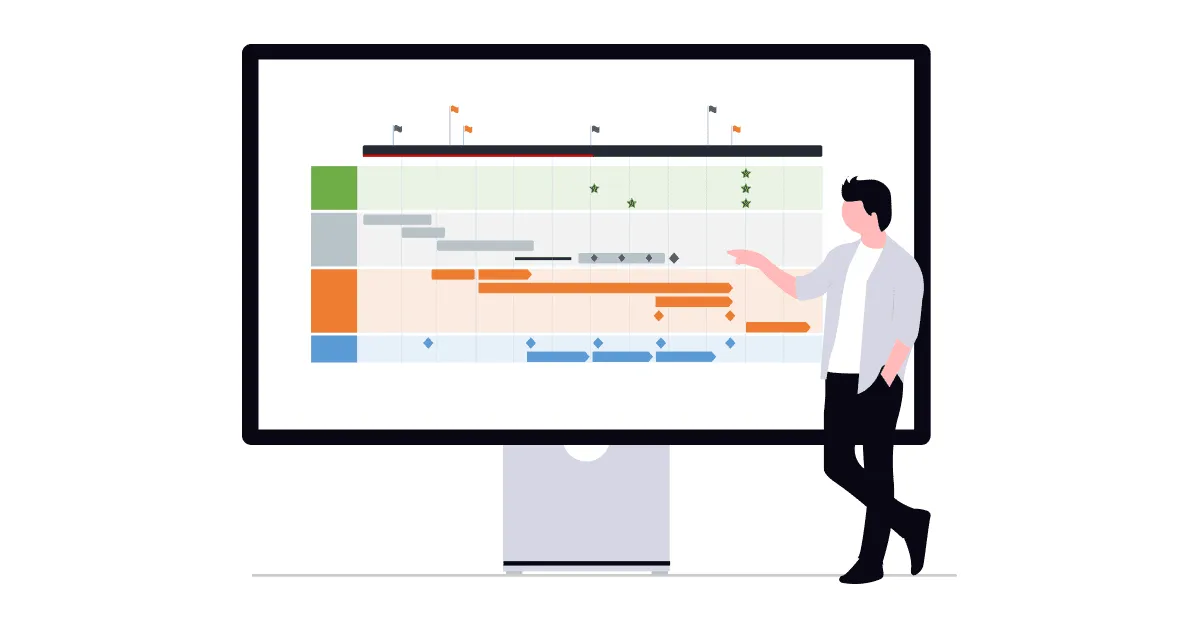
A well-presented plan allows for quick comprehension. Good visuals bring clarity to the chaos, making the data usable, and showing you the project’s progress in the form of a clear timeline - with tasks, milestones and dependencies.
Most financial projects involve complex rules, short timeframes and large sums of money. Efficiency saves time and money.
Think about it: a well-crafted timeline instantly communicates project status, deadlines and potential roadblocks. A Gantt chart can clearly show task dependencies and the critical path, helping you identify possible roadblocks before they become issues.
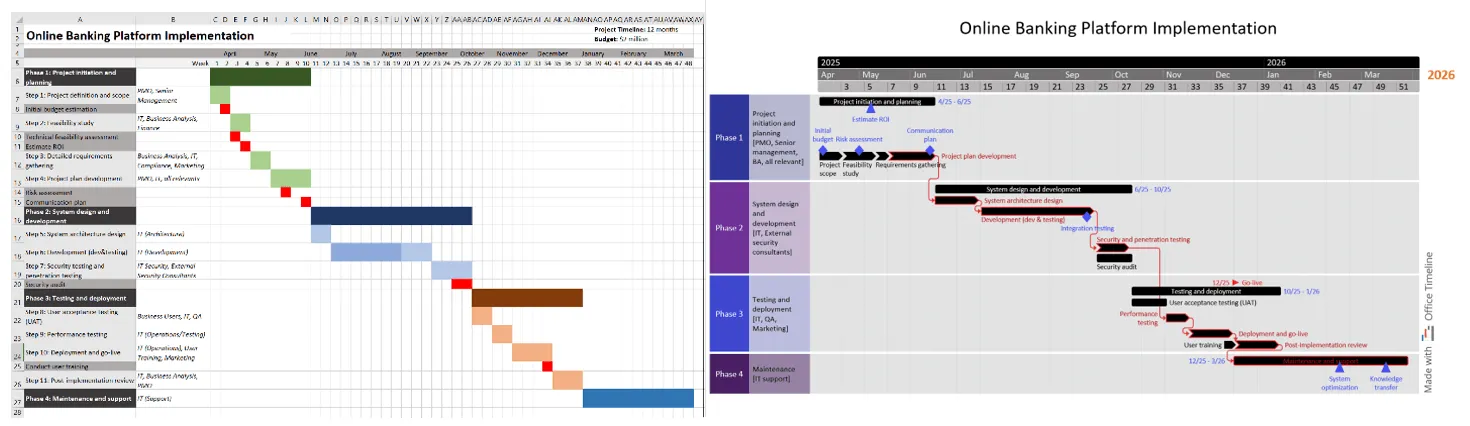
Consider this implementation roadmap: on the left, you can see a typical Excel Gantt chart - lots of data, but not so easy on the eyes. Then, on the right, we've taken the same information and created a cleaner, more digestible visual - much easier to follow for financial planning discussions.
So, how can you create these powerful visuals without spending hours wrestling with design software? That’s where Office Timeline comes in. It’s a friendly add-in for PowerPoint that makes it incredibly easy to create professional-looking timelines, Gantt charts, and project roadmaps. No more manual drawing or formatting - just drag and drop, customize, and you’re good to go.
Let’s look at a few examples of how Office Timeline can be a game-changer for financial professionals:
1. Launching a new investment program
Imagine pitching a new investment product. A wall of text won’t cut it. You need to communicate the key stages of the launch to investors, stakeholders, and your internal team. A visual timeline can help you showcase the program’s roadmap, highlighting tasks, dependencies, key milestones, and the official launch date. To get you started, we’ve created a free, downloadable Gantt chart template specifically for launching a new investment program.
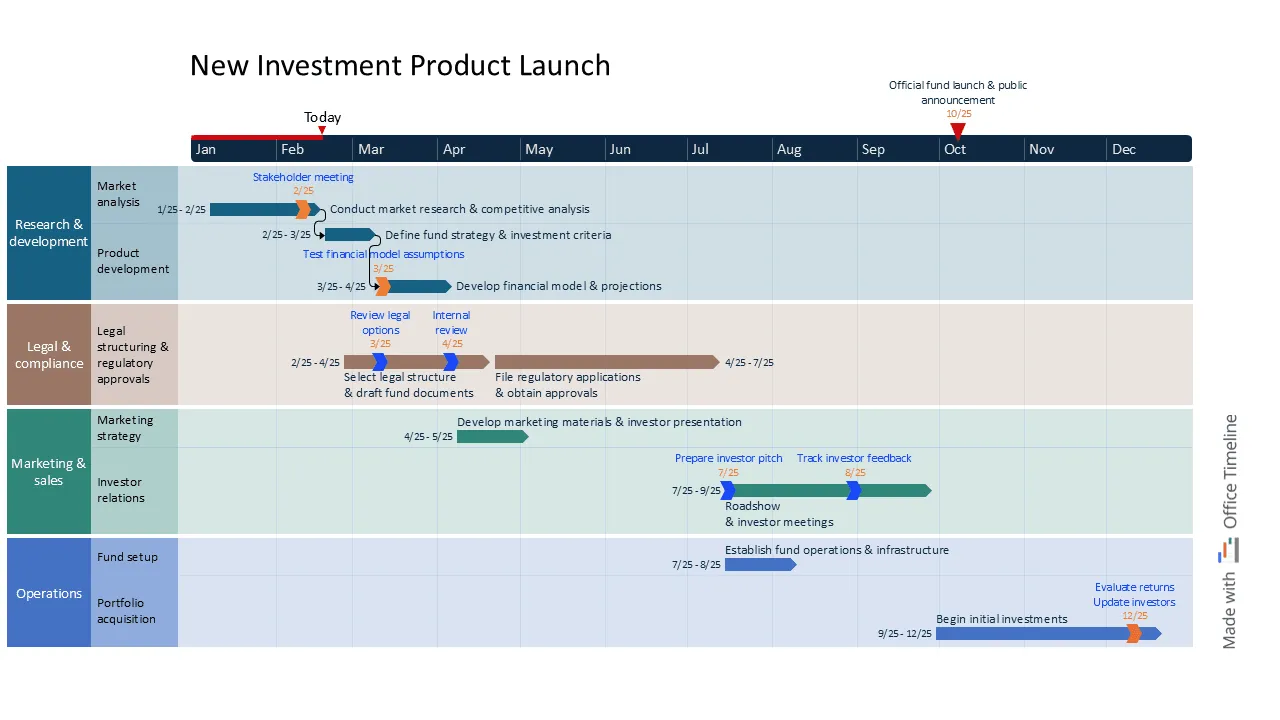
This eye-catching Gantt chart, built with Office Timeline, lays out every step of the process, from initial market research and development all the way to regulatory approvals and your marketing campaign. It’s not just a pretty image; it’s a powerful tool that demonstrates a solid plan.
Seeing this clear roadmap builds confidence in your project and makes a strong case for ROI, attracting potential investors. Plus, you can showcase your data-driven projections right within the timeline, making your strategy even more compelling. A plan everyone understands is a plan everyone can get behind - and that’s how you secure the investment you need.
2. Implementing a new online banking platform
Your organization is upgrading its online banking platform. Awesome! But let’s be real, these projects can become more complicated than you would expect. Think about all the moving parts: choosing the right vendor, figuring out exactly what you need the new platform to do, testing (and re-testing!), training your staff, and then finally, rolling it out to your customers. How do you keep everyone on the same page and avoid a chaotic mess?
You can do this with a clear, visual roadmap of the entire implementation process, like the example below built with Office Timeline. It’s not just a bunch of dates on a calendar; it’s a tool that shows the journey from “we’re thinking about this” all the way to “ta-da, it’s live!”
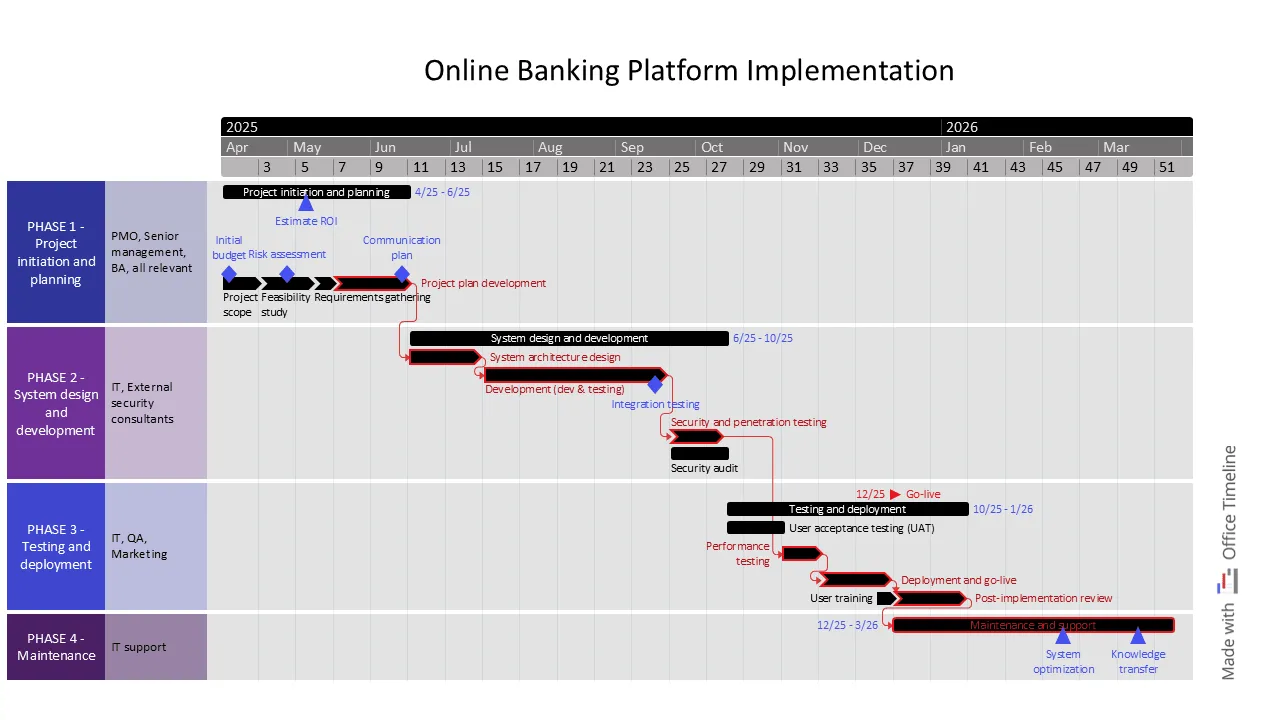
For your internal team, this timeline is a lifesaver. It breaks down the project into manageable chunks, showing who’s responsible for what, when things need to happen, and how everything connects. Need to know when the security audit is happening? It’s right there on the timeline. This level of transparency keeps everyone aligned, reduces confusion, and makes it easier to spot potential problems before they become major headaches. And the bonus: you can see the critical path of the project - the most important route to the finish line. It shows you which tasks absolutely have to happen on time, or the whole project gets delayed. Knowing this helps you prioritize resources and focus on what matters most.
What about your customers? A simplified, customer-friendly version of the timeline can be a great way to build excitement and manage expectations. Imagine showing them milestones like "Beta testing starts next month!", or "New mobile app launching in winter!" - this will not only keep them in the loop but it also shows that you’re working hard to make their online banking experience even better. It builds trust and can even turn potential anxiety about changes into anticipation for new features.
Bottom line: a well-crafted timeline can be your secret weapon for a smooth, transparent, and successful online banking platform launch.
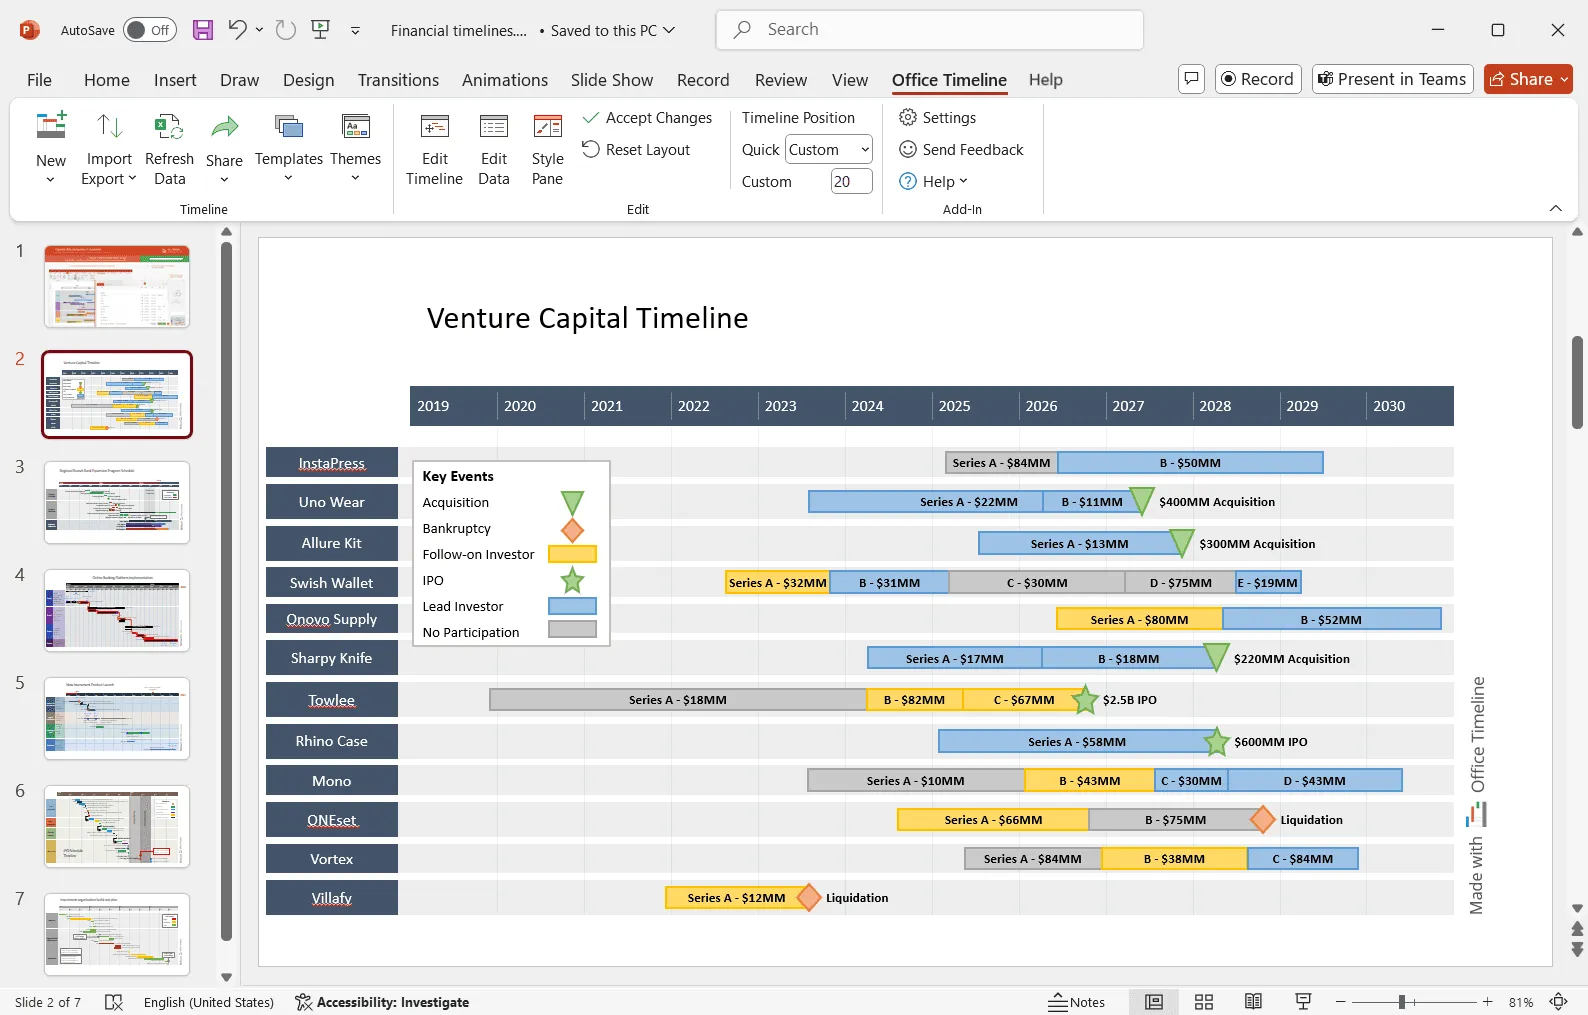
3. Visualizing the private equity transaction process
Let's take another example - private equity deals. Quite complex, involving a lot of moving parts. You've got target companies, due diligence, negotiations, financing… the list goes on. It's exciting, sure, but it can also get overwhelming fast. How do you make sure everyone's on the same page and avoid a total communication breakdown? Simple: a powerful timeline.
Think of it as your trusty GPS for the entire deal process. Instead of just a bunch of dates scattered on a calendar, it's a visual guide to the whole transaction. Tools like Office Timeline make it easy to create these visual roadmaps.
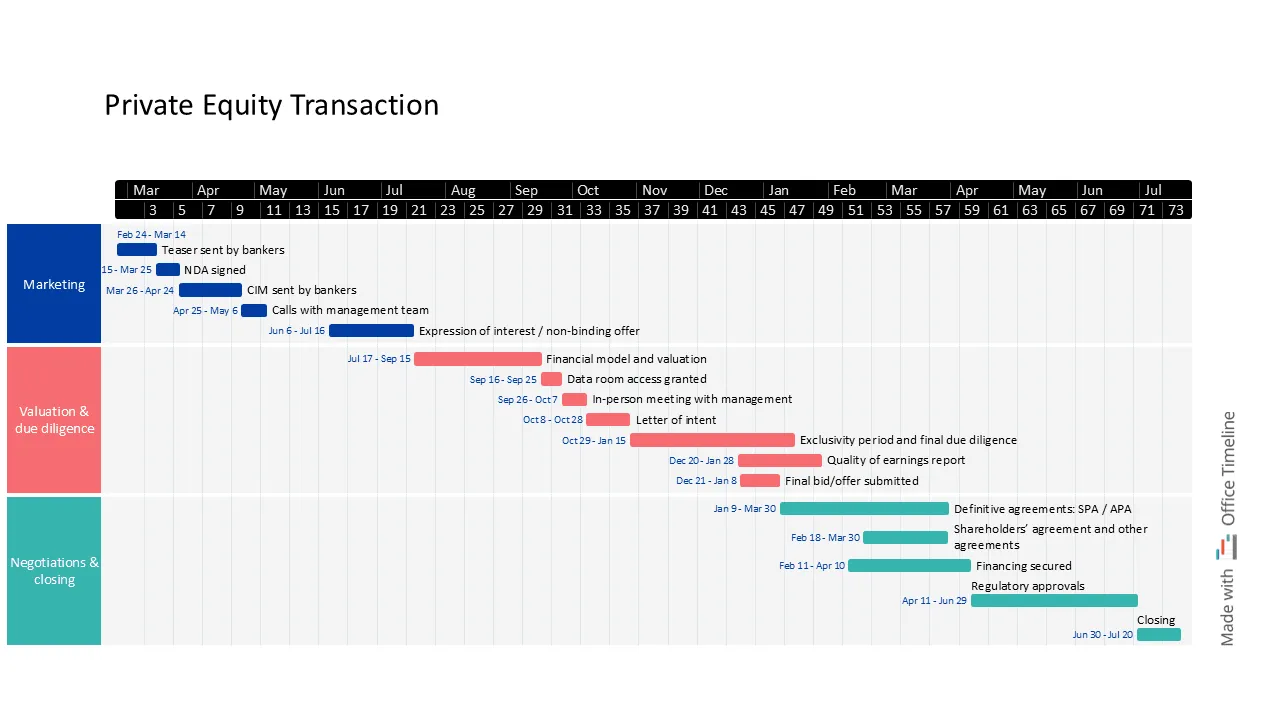
This timeline offers a clear picture of the typical progression of a private equity transaction, from initial contact with a target company to deal closing. It shows the main phases: initial information exchange and confidentiality agreements, due diligence, negotiations, and closing.
For the deal team, this visual representation helps clarify when important things need to happen, and what the most important steps are. It lays out clear responsibilities, milestone tracking, and task dependencies and helps keep everyone on the same page, making sure the deal moves forward smoothly.
And let's not forget your investors. They're just as invested (pun intended) in the deal as you are. A simplified version of the timeline keeps them in the loop and builds confidence.
In short, a well-crafted timeline provides visibility into the deal's progress and supports organized deal execution.
Office Timeline: easier planning for financial projects
So, there you have it! From launching a new investment program and rolling out a new online banking platform to working through the complexities of a private equity deal, we've seen how timelines can enhance collaboration and bring clarity to financial project planning.
Office Timeline makes it really easy to create these visual roadmaps. It works right inside PowerPoint, so you don't have to learn a new program. It’s drag-and-drop easy, and you can customize everything from colors and fonts to how tasks are linked, so your timelines look professional and perfectly reflect your project. And the best part? You can update your visuals effortlessly as your projects evolve, saving you time and effort. When you're working with numbers and deadlines, clear communication is a top priority.
Office Timeline helps you turn all that information into visuals that everyone can understand. Ready to make your financial projects shine? Give Office Timeline a try! Get the advanced features for free for 14 days.
FAQ about financial planning and communication
We've covered how timelines can be a practical solution for collaborative financial planning and improved communication. Now, let's address some common questions professionals ask.
The best way to present financial information is to adapt it to your audience. Use clear, concise language, and choose the right visuals (timelines, Gantt charts, graphs) to highlight key takeaways. Focus on the story the data tells, and emphasize the “so what?” - what does this information mean for the audience?
Communicate financial results to stakeholders clearly and concisely, focusing on the key takeaways and their impact. Use visuals (timelines, Gantt charts) to illustrate trends and performance. Adapt the level of detail to the audience's financial expertise, and be prepared to answer questions. Choose the right communication channel (presentations, reports, emails) for the situation.
Common financial communication mistakes include: using jargon the audience doesn't understand, burying key information, neglecting the “so what?” (impact), relying too heavily on raw data without analysis, and failing to adapt the message to the audience's needs. Also, avoid overly complex visuals and inconsistent terminology.
If you want to prepare a winning investment pitch, these are the basic steps that are needed: know your audience, define the problem, highlight your unique value, quantify returns realistically, address risks, and end with a strong call to action.
Private equity transactions involve these main steps:
- Sourcing/origination. Identifying and screening potential target companies.
- Due Diligence/valuation. Thoroughly investigating the target and determining its worth.
- Deal structuring/negotiation. Agreeing on deal terms (price, structure) and finalizing legal agreements.
- Financing. Securing the funds needed for the acquisition.
- Closing. Completing the transaction and transferring ownership.
- Post-acquisition. Managing the acquired company to improve performance and eventually exit the investment.
Project management tips and tricks
Turn project data into professional timelines
Get the advanced features of Office Timeline free for 14 days.
