[Study] How to save time and money in project reporting
Save 4 hours per week on reporting with Office Timeline. Explore how this tool transforms project management and makes reporting a breeze.
Do you often feel like there aren’t enough hours in the week? Like no matter how hard you try, you simply cannot split your time effectively between all of your responsibilities?
First of all, you are not alone. This sentiment is shared among thousands of project management professionals and other knowledge workers across the globe.
Secondly, there is help. With the right tools, you can get more than 4 (four!) hours of your week back by streamlining a fundamental part of PM: creating reports and visuals.
In this article, we’re going to show you how to spend less time on project reports so you can go back to spending more time on actually managing your projects.
Insights on improving project reporting
How important is your time? That’s an easy question to answer. World-renowned author, entrepreneur and motivational speaker Jim Rohn described time as the most precious commodity available to us in one of his most famous quotes: “You can get more money, but you cannot get more time.”
While most of us resonate with this logic, it’s often too easy to get bogged down by the downpour of boring tasks that we perceive as necessary or simply unavoidable. We accept time-consuming routines reinforced by office life without a second thought. Inevitably, we end up spending hours on things that could be completed in minutes, if only we’d be willing to look for the right tools.
So we come to ask ourselves: why is so much time wasted in project management? For a better understanding of our context, we will take a look at some industry reports that showcase the daily challenges of PMs, and an estimate of the time spent on reporting.
50% of project managers spend at least one day creating project reports manually
Wellington's Annual State of Project Management Report 2021 reveals that project managers frequently struggle with time management due to the high volume of tasks they must juggle. The report highlights the significant amount of time spent on manual data entry and report creation, which are both time-consuming and repetitive.
It suggests that the use of better tools and integrations could streamline these processes, leading to substantial time savings. By automating these tasks, project managers can allocate more time to strategic planning and execution, thus enhancing project outcomes.
The report emphasizes that adopting advanced project management tools can reduce the administrative burden on project managers, allowing them to focus on higher-value tasks that drive project success.
These tools can automate routine reporting, integrate seamlessly with other project management software, and provide real-time data updates, all of which contribute to more efficient project management.
22% of PMs struggle with generating status reports
Another study, the PMO Outlook Report 2023, shows that a considerable number of project managers find visibility and reporting to be their biggest challenge, with 16% of respondents highlighting this issue. This is often because teams rely on spreadsheets or fragmented systems that aren't efficient for portfolio management.
The main pain-points consist of having non-centralized project portfolio data and the lack of real-time updates, both cited by 28% of respondents. Additionally, 22% struggle with generating status reports and integrating data from external systems. Improving real-time data access and centralizing information were crucial focuses for PMOs in 2023.
In Wrike's Efficiency Report 2023, findings indicate that project managers spend a significant portion of their time on administrative tasks, including project planning, reporting, and communication. Efficient use of project management reporting tools can significantly reduce this time burden.
We get it – reporting can be a real headache for project managers. Between handling tasks and piecing together data from different sources, it’s easy to feel overwhelmed. You’re not alone in facing these frustrations.
Key findings from the Office Timeline user survey report
To understand these challenges better, we’ve also done our homework. In our latest survey, we’ve uncovered some eye-opening insights on how you can save hours and dollars each week by simplifying your reporting process. Up next, we’ll share these findings and some practical tips to make your life a bit easier.
About the Office Timeline user survey
As we always look to get a sense of the industry, in September 2022 we interviewed 375 professionals who agreed to fill in our questionnaire, about their habits and preferences related to project management and reporting.
The study included people with job titles ranging from Senior Project Manager, Director of Project Management and VPs/Presidents to Team Leads, Analysts and Project Managers. With regards to their accreditations, our respondents boasted PMP, PMI, PgMP, Prince2, CSM and similar certifications. Most (92%) of the survey subjects were located in the United States, but there were also global participants.
Let’s have a look at the most important findings that came up from this report.
Next, let's discuss what these findings mean for a project manager's life and how we can integrate them in our workflows.
Microsoft Project, Jira and Smartsheet are the most popular PM solutions
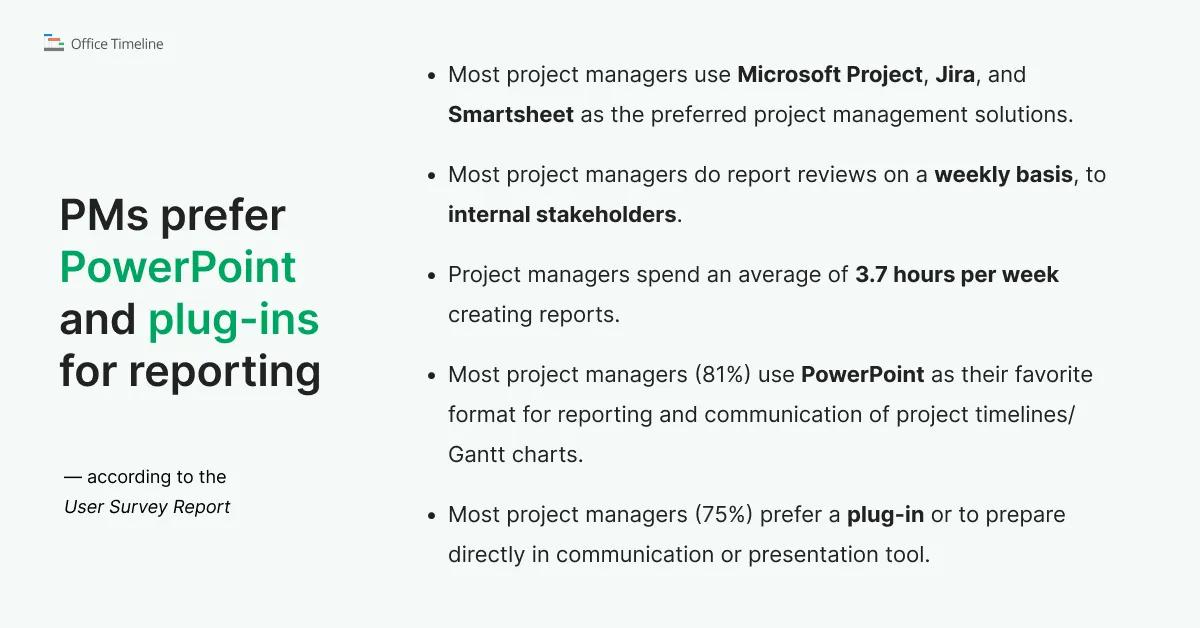
The survey revealed that Microsoft Project, Jira, and Smartsheet are the top project management tools among professionals, reflecting their robust features and widespread integration.
However, while these platforms perform adequately in project planning and tracking, visual reporting is still a challenge. Ever find yourself juggling all the details in Microsoft Project or Jira, wishing there was an easier way to extract and present the key data?
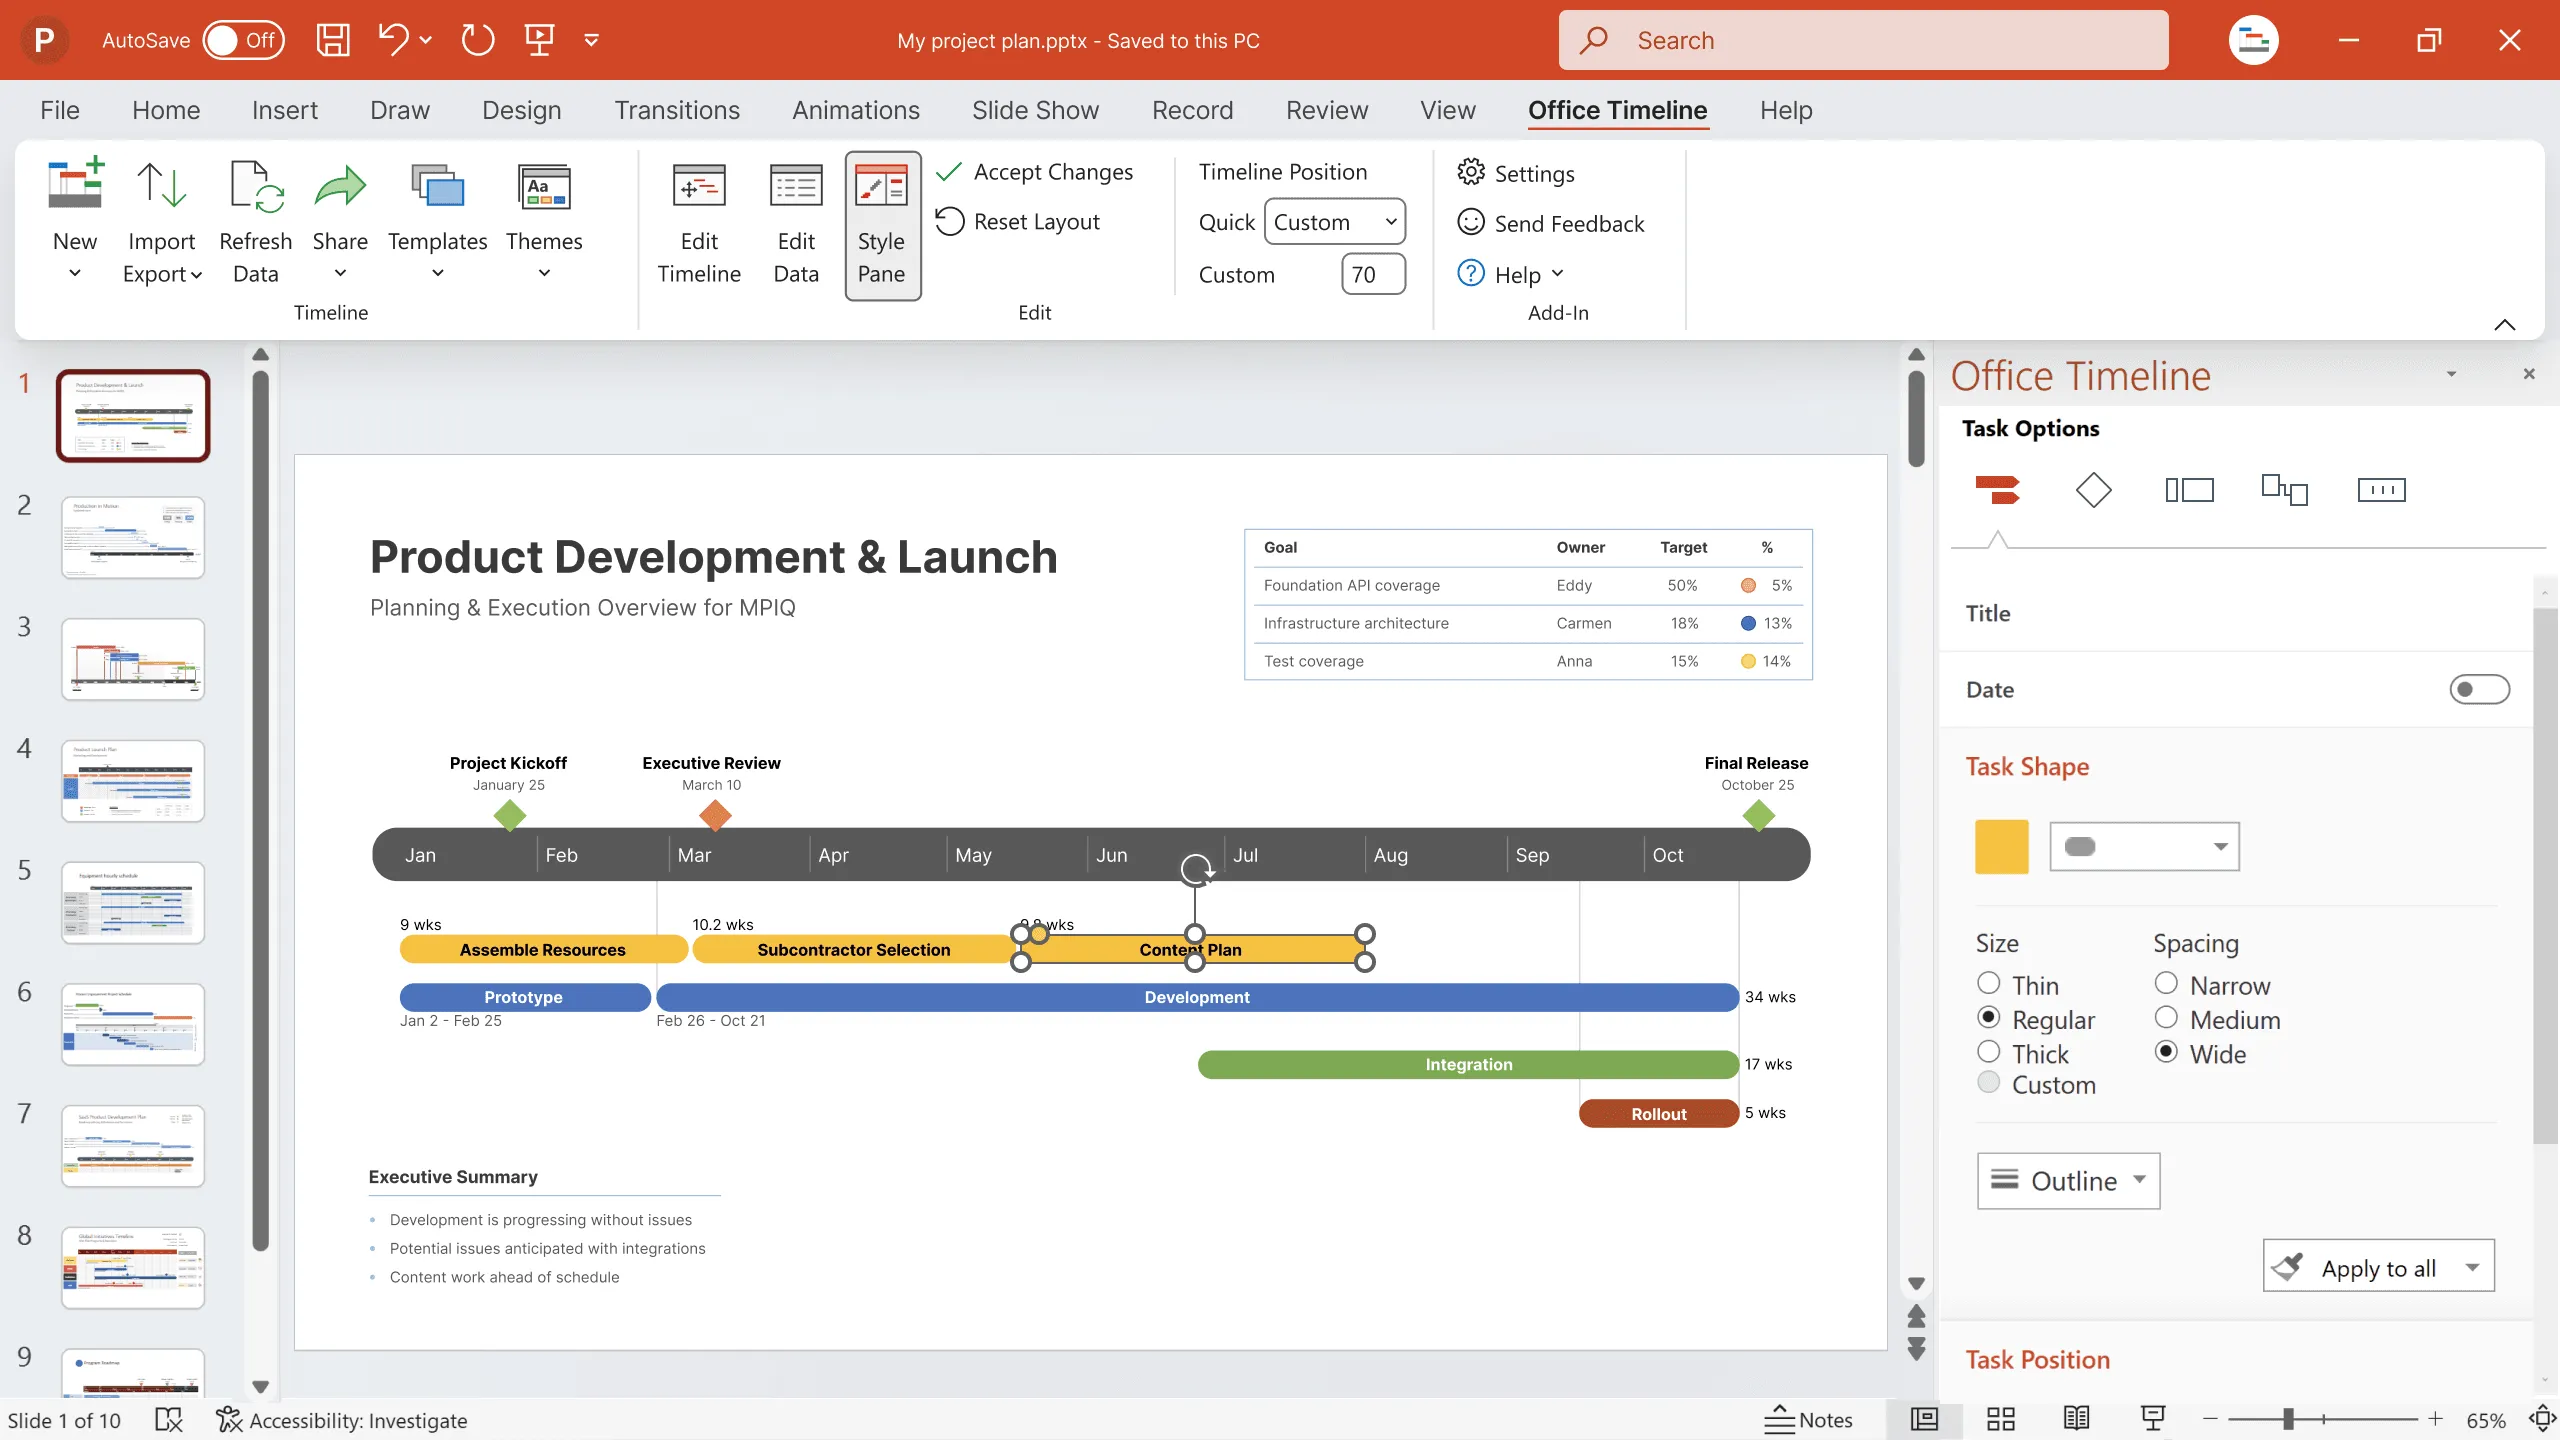
We know that these PM tools are good for keeping everything organized, but when it comes to creating clear, easy-to-follow timelines, it can be a bit tricky. That’s where Office Timeline comes in handy. It integrates smoothly with tools you’re already most likely using (MS Project, Excel, Jira, Smartsheet and Wrike), helping you turn all that project data into clear, beautiful visuals.
So whether you're updating your team or presenting to stakeholders, you can do it in a way that’s both effortless and effective.
Most reporting tasks are done weekly and for internal stakeholders
When you’re the PM, those weekly check-ins with your internal teams and the senior management are crucial. It’s all about keeping everyone aligned and making sure the project is moving in the right direction. But let’s face it – summarizing a week’s worth of progress and challenges in a way that’s clear and engaging isn’t always easy.
If you’re using Office Timeline, though, that process becomes a lot less painful. Instead of getting bogged down by trying to create visuals from scratch, you can quickly generate (and freshen up) timelines that highlight the key milestones, task updates, and any potential risks.
This way, your team gets the information they need at a glance, and you can spend less time (we’ll crunch the numbers on that in a moment) formatting and more time strategizing for the week ahead.
Most PMs use PowerPoint for reports in timeline or Gantt chart form
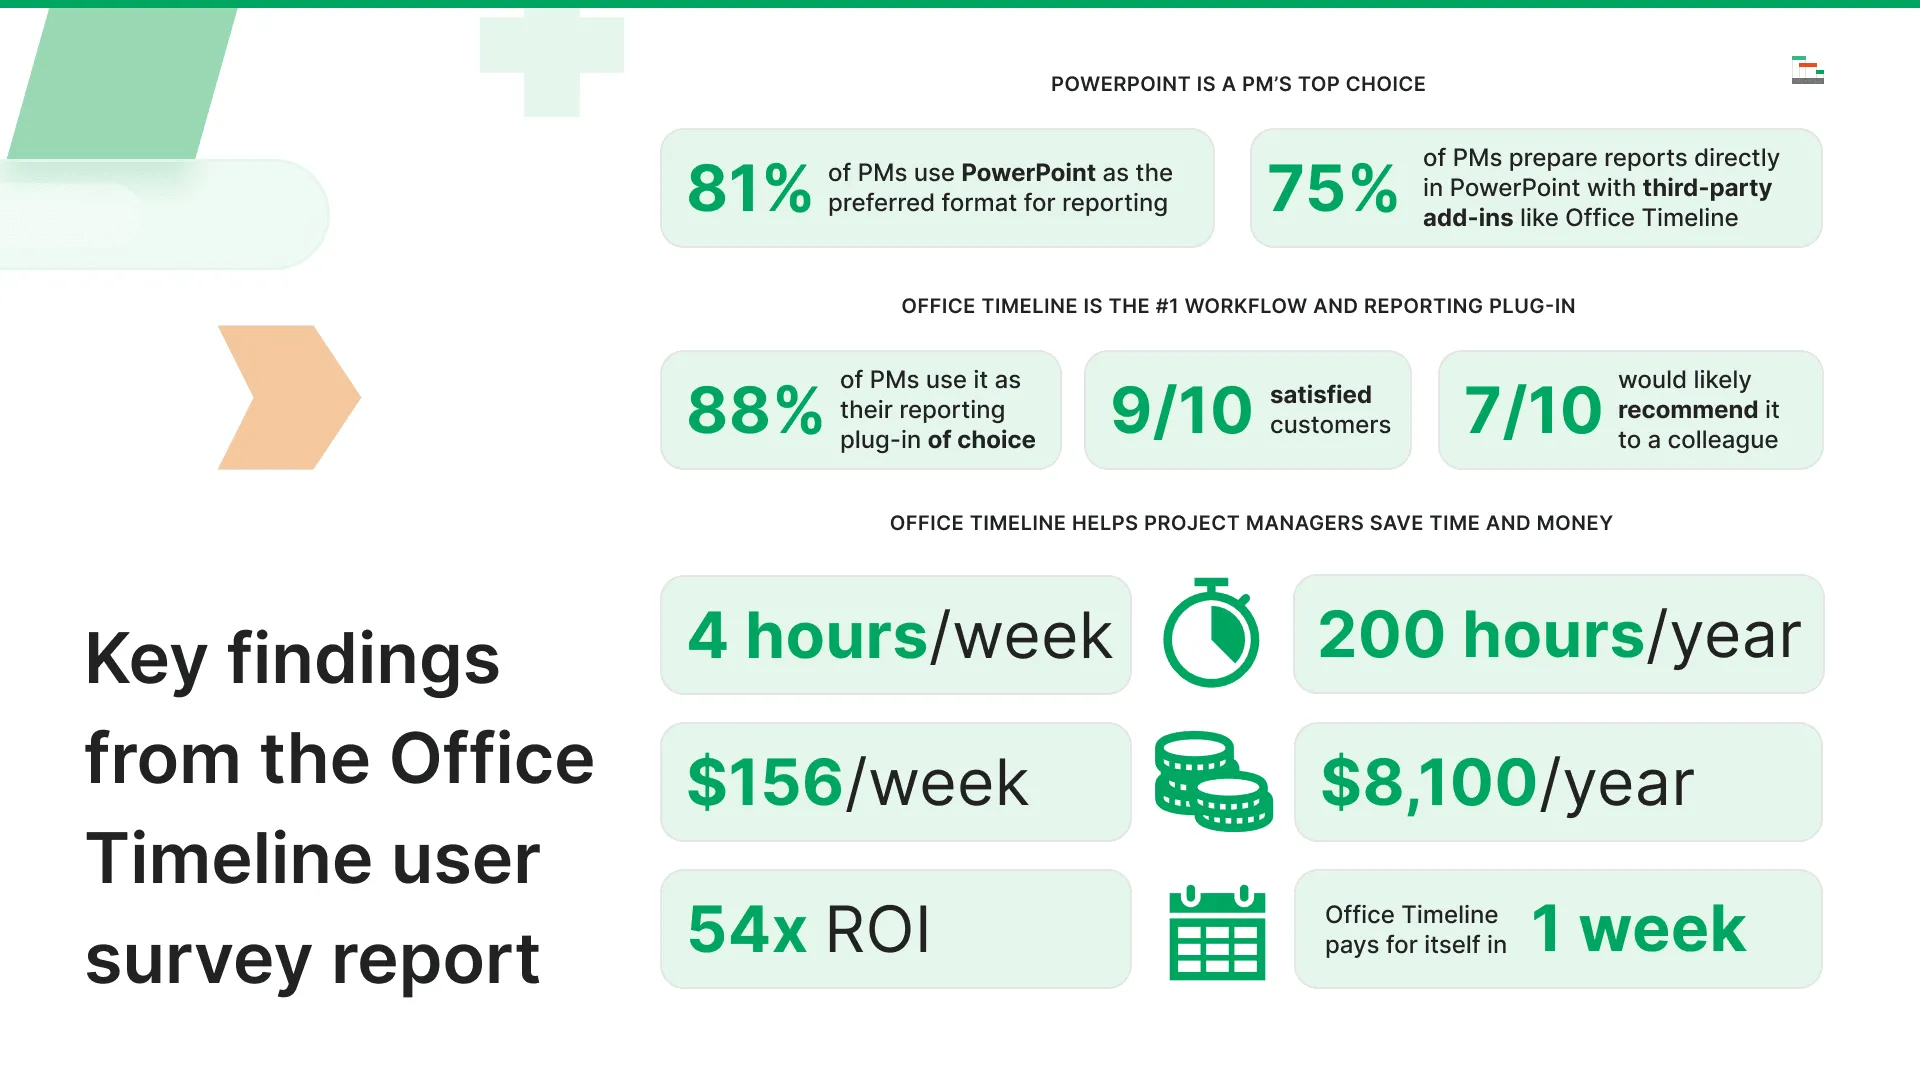
It comes as no surprise that PowerPoint is leading in the poll as the number one tool for reports that rely on graphics like Gantt charts or timelines, and by a huge margin too: 81%. Intuitive, familiar to everyone since the dawn of the IT age and highly modular thanks to its capability to integrate add-ins, Microsoft’s presentation software is a favorite of project managers worldwide.
But, while it may very well be the best thing since sliced bread, creating timelines and Gantt charts using exclusively the native PowerPoint functions is neither easy nor fast. To optimize the process, most PMs (75%) prefer to prepare reports directly in PowerPoint and integrate a third-party add-in like Office Timeline. Which brings us to our next point.
Office Timeline is the #1 reporting plug-in used by project managers
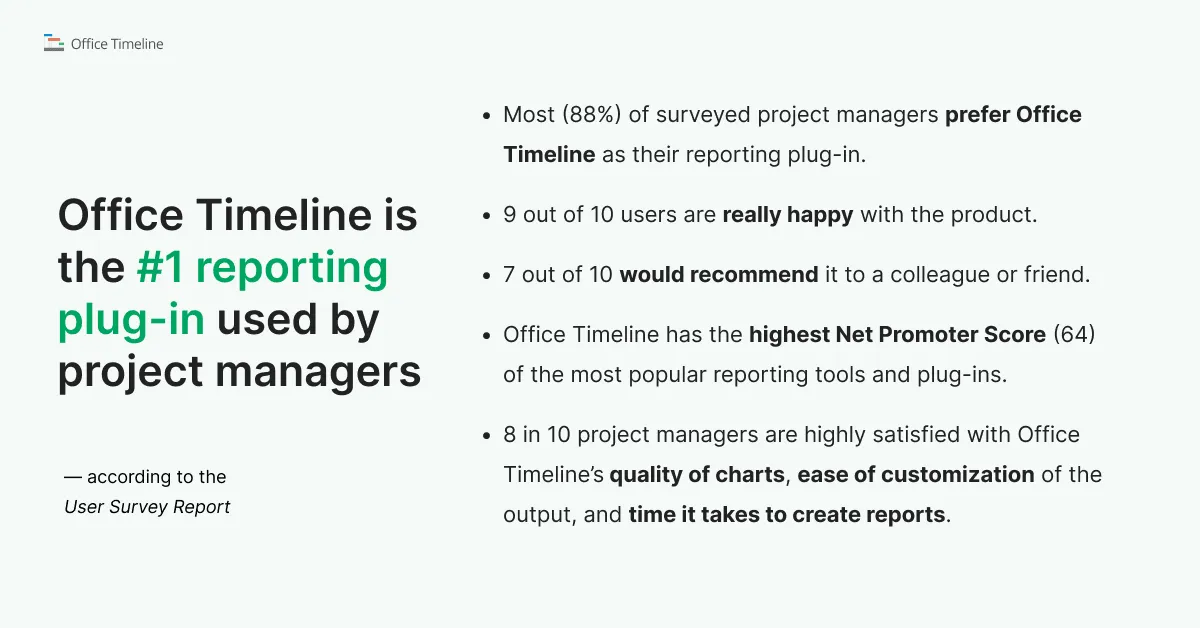
So, if PMs like to enrich the functionality of PowerPoint with add-ins and plug-ins, which ones do they prefer for Gantt charts and timelines? An overwhelming 88% percentage of our interviewees stated that Office Timeline is their reporting plug-in of choice from a list of 11 tools that are most popular among project managers.
What’s more, 9 out of 10 users are really happy with the product and 7 out of 10 would recommend it to a colleague or friend. This is, we believe, consistent with the NPS (Net Promoter Score) of 64, the highest value among other popular tools and plug-ins available on the market right now.
PMs save 4 hours of work per week using Office Timeline
Our survey participants revealed that, on average, approximately 3.7 hours of their work week are spent on creating reports. Furthermore, the percentage of PMs that already use Office Timeline estimated that, without it, the time they’d need an extra 4.1 hours every week on making or updating project timelines and Gantt charts.
To put that in perspective, 4 hours a week on reporting adds up quickly- 200 hours (or 5 weeks) a year. Not ideal.
What if you could reclaim some of that time? With Office Timeline, you can. Instead of spending hours fine-tuning reports, you can quickly create polished timelines that clearly communicate progress.
This not only reduces the time spent on reporting but also leaves you with more hours in the week to focus on strategic planning, problem-solving, and leading your team.
What’s the ROI like on Office Timeline?
Let’s dive into how Office Timeline can be a real game-changer for you as a project manager. If you’re like most PMs, you too probably spend more than four hours each week on reporting alone. Now, think about this: with an average hourly rate of $38, that’s $156 every single week just for reports. Over the course of a year, that adds up to more than $8,100.
Here’s where Office Timeline comes in. A yearly license costs, on average, around $149. That means your return on investment (ROI) is a jaw-dropping 54 times the cost of the license. In other words, you’re looking at almost $7,950 in savings just by making this switch.
But let’s zoom out for a moment. Across 27,000 active customer accounts and over 131,000 licenses, Office Timeline is collectively saving project managers like you around 500,000 hours a year on reporting. That’s not just time saved – it’s nearly $1 billion in revenue kept in the pockets of project management professionals.
Office Timeline pays for itself in a week
But let’s look at it from another perspective. If you consider the average rate for PM jobs is around $38 per hour, then those 4.1 hours saved translate to saving $156 per week. Now, remember that an average Office Timeline license costs $149 per year. In other words, Office Timeline effectively pays for itself in the span of a week, and then continues to save you lots of money for the rest of the year.
In short, Office Timeline isn’t just another tool in your arsenal — it’s a smart investment that can transform how you work and save you serious money.
But you may be wondering what are the features that put Office Timeline on the map. Let’s find out.
Extra points for quality of charts, ease of customization, and times it takes to create reports
Among the most appreciated features of Office Timeline, according to 85% of the PMs in our study, is the time it takes to create charts or reports, those 4 hours that of work that can be done in minutes. Also, 88% of our users were very happy with the quality of the visuals produced, which are on par with or exceed their expectations.
On the same note, 83% reported being impressed with the ability to export and edit graphics in other communication tools they employ daily, and 86% were satisfied with the ease of customization, the fact that it doesn’t have a steep learning curve.
In short, users find Office Timeline to be an effortless way of creating striking graphics that you can personalize and share according to your needs.
Making the most of Office Timeline
Based on the results of this survey, corroborated with other industry research outcomes, here are our conclusions:
- Reporting is essential, yet time-consuming: It’s one of the most crucial tasks in a project manager’s responsibilities, but it can also eat up a lot of your time.
- Most project managers choose Office Timeline as their favorite reporting plug-in: Users confirm their preference for a tool that helps them deliver better, faster reports.
- Office Timeline is built for easy project reporting: This tool is widely recognized in the industry for its ability to save project managers and their organizations significant amounts of time and money.
Let’s talk about a few things that can help you maximize the benefits of integrating this popular PowerPoint add-in in your workflow:
- Customize templates to fit your projects: Tweaking the built-in Gantt chart and timeline templates or create your own to match your project’s unique needs. Using templates instead of starting from scratch not only saves you time but also ensures that your reports look consistent and professional. Further to this point, remember that you can save and share templates with your team, standardizing processes and replicating success across projects.
- Take advantage of integrations: The add-in is capable of integrating with the most powerful PM solutions like MS Project, Excel, Jira, Smartsheet and Wrike. This allows you to directly import data from these sources and create amazing visuals in minutes, rather than input all the tasks and milestones by hand.
- Use swimlanes and dependencies: Beside the classic timeline and Gantt charts formats, Office Timeline includes features like swimlanes (that allow you to break up your graphic by department/team/processes) and dependencies (that enable showing the direct correlation between tasks and progress milestones).
Check out the extensive support library: Office Timeline may be simple and intuitive, but we’re willing to bet there are still a few features under the hood that you don’t know about. Don’t worry, you can find out all you need to make the most of our reporting powerhouse by accessing the support section of our website.
Conclusion
Project management is all about time – how you spend it and where you can save it. Reporting is essential but can quickly become a burden, eating away hours that could be invested in more strategic tasks. Office Timeline offers a solution by helping project managers create professional, easy-to-understand visuals in a fraction of the time.
In fact, our recent survey found that project managers spend nearly 4 hours each week on reporting tasks. Using Office Timeline, they succeed in getting that time back and using it to focus on what really matters — leading their team, solving problems, and driving their projects to success.
The return on investment for Office Timeline speaks for itself. With a 1-year license costing an average of $149, the time and money saved by using this tool can add up to over $8,100 annually. That’s 54 times the cost of the license — a smart investment by any measure.
To make the most of Office Timeline, customize templates to fit your project’s needs, take advantage of integrations with tools like MS Project and Jira, and explore advanced features like swimlanes and dependencies. With these tips, you can unlock even more time savings and efficiency.
By integrating Office Timeline into your workflow, you’re not just saving time — you’re enhancing the quality of your work and gaining a competitive edge in your project management career.
Final thoughts
Download the trial version of Office Timeline and gain unlimited access to all the powerful features that can help you transform complex and boring sets of data into amazing and engaging visuals. What would you do if you could get five weeks of your time back per year?
Project management tips and tricks
Tagged With:
Project reportsTurn project data into professional timelines
Get the advanced features of Office Timeline free for 14 days.


