How to choose the right Gantt chart maker [+checklist]
Take a look at the criteria you should consider when choosing a Gantt chart maker. Try the Office Timeline tool for free and create amazing project visuals.

Few things in the ever-busy world of project management bring the peace of mind a Gantt chart does. From scheduling tasks and setting deadlines to delegating work and keeping track of progress, Gantt charts help you stay organized and keep everyone in sync so that you can deliver impressive results right on time.
To make the most out of what the Gantt chart has to offer and save precious time, you first need to find the right Gantt chart maker. With dozens of tools available, we’re aware that this can be a time-consuming task, but don’t worry — we’ve got a few useful tips ready to share with you (and maybe even your next favorite Gantt chart creator). Before we go into the key features a Gantt chart creator should have, let’s take a quick look at the main benefits of using such a tool for your projects.
Why use a Gantt chart maker?
Having a Gantt chart tool you can count on whenever you need to plan, organize, and manage a new project is going to make your life a lot easier. Here are the top four reasons why you should use a Gantt chart maker to simplify your life and work:
1. Save time when creating project schedules
When you’ve got multiple projects to manage, reports to create, and meetings to attend to, the last thing you want to do is spend a couple of hours trying to build a Gantt chart from scratch. Modern Gantt chart software lets you quickly import data into pre-designed Gantt chart templates and customize it based on your project requirements.
2. Distribute your team’s workload more efficiently
Some Gantt chart makers allow you to visualize tasks across multiple projects in one single chart. This way, you’ll be able to see at a glance the work that needs to be completed for each project and assign members of your team to specific tasks while making sure that no one is overwhelmed.
3. Enhance team collaboration and productivity
When you display all the tasks in one place, your team can better understand who is responsible for what and how project activities relate to one another. Moreover, a Gantt chart creator provides colleagues and managers with a visual representation of the project schedule they can refer to at any time, thus keeping important milestones and deadlines top of mind.
4. Track progress in real time and improve stakeholder communication
With a Gantt chart generator, every meaningful change is recorded on your chart so that you always know if work is progressing according to the initial plan or if there are any roadblocks you have to manage. Plus, you can use your Gantt chart to effortlessly update key stakeholders whenever an executive meeting is coming up.
What should you look for in a Gantt chart maker?
To help you out on your search, we’ve gathered a list of seven criteria you can use to rank the top Gantt chart makers available on the market and discover the one that best suits your needs.
1. Intuitive user interface
Even the most powerful Gantt chart maker loses its appeal if the user experience it delivers doesn’t match the customers’ expectations. Since this is a tool you’re going to use daily to plan and schedule tasks across projects, it should enable you to focus on your work without interruptions.
2. Ease of use
A Gantt chart creator that’s easy to use is already a big win in anyone’s book. As change is the only constant in project management, you’ll have to adjust your chart frequently to keep your data accurate and your project on track. That’s why the tool you choose should have a frictionless drag & drop layout and provide user-friendly tutorials, enabling you to cut the learning curve in half.
3. Integrations
There’s nothing better than using a Gantt chart creator that seamlessly integrates into your workflow and connects with the other project management tools you’re already using. Look for a Gantt chart maker that allows you to easily import project data from your usual PM software (Excel, MS Project) and turn it into clear visuals that can be integrated immediately in your project reporting.
4. Built-in templates
Ready-made templates act as a starting point for your Gantt chart and help you save those long hours you would have spent trying to get the design right by yourself. We recommend you look for a Gantt chart generator that offers a wide collection of templates, which cater to different industries, types of projects, and planning needs.
5. Customization features
The Gantt chart’s magical powers lay in its visual nature, so it’s best to look for a tool that enables you to present your data as engaging as possible. A simple yet feature-rich Gantt chart maker will let you customize shapes, colors, date formats, progress indicators, and task duration, group activities into swimlanes, and add multiple timescales for complex projects.
6. Shareability and collaboration
Since successful project completion depends on effective team collaboration and communication, you need to ensure that the Gantt chart creator you’ll use has the features to support that. In other words, you have to be able to effortlessly share the visuals with the team and executives, set permissions, and work together on the same Gantt chart to make changes as fast as you need them.
7. Value for money
Not all tools are created equal. Each software comes with a different set of features and capabilities that might or might not align with your project work requirements. You need to make sure that the price they charge is justified, and the easiest way to do that is to use the free version (if available) or start a free trial that allows you to put the tool’s strengths to the test.
Gantt chart checklist
To recap on all that, here’s a quick CHECKLIST you can use to find the best Gantt chart software for you and your team:
- How intuitive are the layout and navigation?
- Is the tool easy to use? Does it have drag & drop functionality? Does the company provide tutorials or other training materials on their website?
- Does it connect easily with other tools you’re currently using?
- Does the tool offer pre-designed templates? Do these templates cover a wide range of scenarios?
- What type of data can you display? How much can you customize a chart? Do the visuals look professional?
- Can you share the visuals you create with other people? Can multiple people work on the same visual? What export file formats does it support?
- Is the price appropriate for the features it provides?
Gantt chart maker FAQ
Here are the answers to the most frequently asked questions about Gantt chart makers.
Modern Gantt tools enable users to seamlessly transform complex project data into presentation-ready visuals that can be shared with the whole team and updated in real time with just a few clicks.
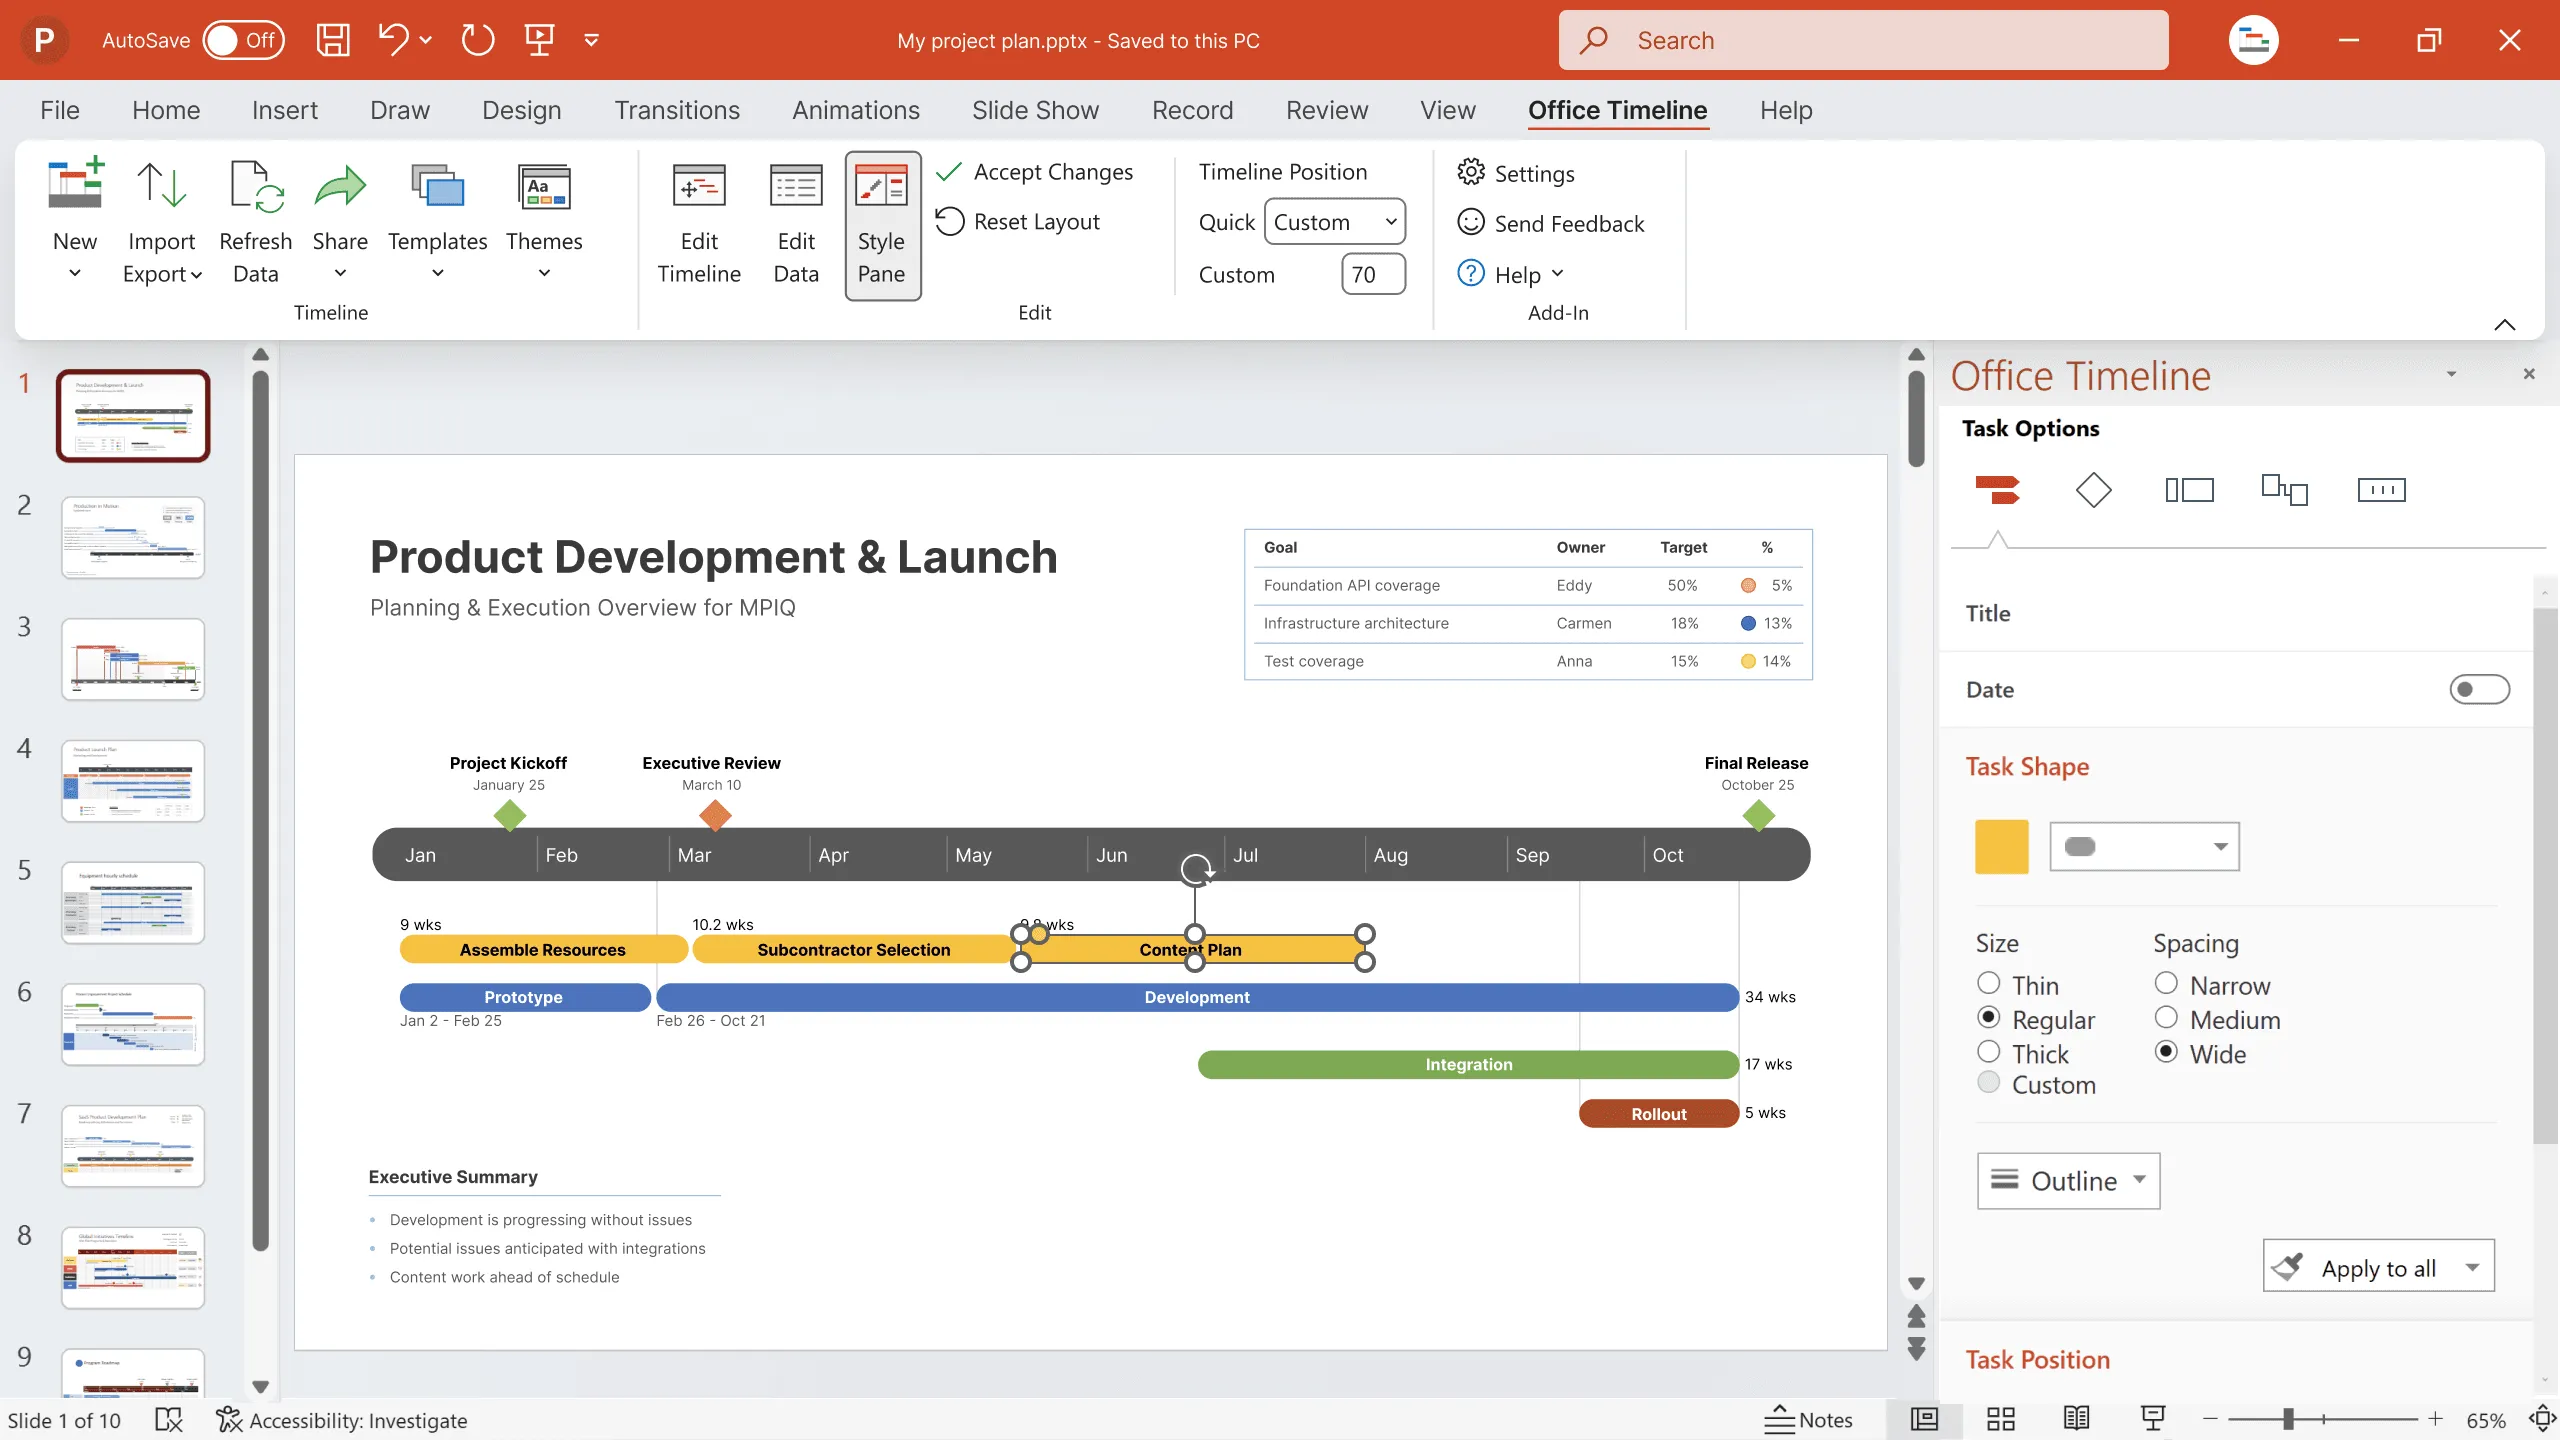
Thanks to the extensive gallery of pre-designed Gantt chart templates, intuitive drag & drop interface, integration with popular tools such as Jira, Excel, MS Project, Wrike, and Smartsheet, and powerful customization features, Office Timeline is among the top Gantt chart makers out there. Plus, it’s available both as a PowerPoint add-in and web tool.
Unless you’re super confident in your design skills and have enough time to spare, the best way to make a Gantt chart is to customize a ready-made template that fits right into your PowerPoint presentation. And who doesn’t want to have a beautiful chart ready in less than 5 minutes?
There are several ways to create your own Gantt chart — either you use a traditional office tool such as Microsoft Project or Excel, customize a pre-built Gantt chart template available online, or employ a Gantt chart maker.
Regardless of the solution you choose, we recommend you first check out our Gantt chart 101 series, where we explore in detail how a Gantt chart works, the elements it must include, popular use cases, and more.
Although Excel or Google Sheets are standard options, you deserve better. That’s why we invite you to try out the advanced features of our Gantt chart maker Office Timeline Pro+ and create professional-looking Gantt charts for free. With the help of sub-swimlanes and multiple timelines, you can now easily get a clear overview of your entire project portfolio with both long-term and short-term goals.
Project management tips and tricks
Tagged With:
Gantt chart 101Turn project data into professional timelines
Get the advanced features of Office Timeline free for 14 days.


