Pharma Project Management: using timelines in pharmacokinetics tracking
Use timelines to track pharmacokinetics parameters and applications. Free practical examples.

In the pharmaceutical industry, where precision and adherence to regulations are, quite literally, vital, managing the pharmacokinetics of drugs —how they are absorbed, distributed, metabolized, and excreted from the body— is a complex and necessary task. Effective tracking can make a significant difference in the success of drug development and patient safety. This is where clear and detailed timelines come into play.
Timelines offer a visual roadmap of the entire drug development journey, from the initial research stages through to clinical trials and beyond. By laying out key milestones, deadlines, and dependencies, timelines ensure that every step of the pharmacokinetics process is meticulously tracked and managed.
In this article, we will explore ways to use timeline modeling in pharmacokinetics, that can simplify tracking of processes and their applications. It will also show why pharmacokinetics processes play a central role in the development and delivery of pharmaceutical products. All with the help of practical examples that you can download and use for free.
What is pharmacokinetics?
In basic terms, pharmacokinetics (abbreviated as PK) is the branch of pharmacology that studies how the body processes medications over time. “Pharmacokinetics” literally means the movement of drugs within the body. The term “pharmacokinetics” has its roots in Greek: “phármakon” means “medicine” and “kinitikós” means “relating to motion” (from “kínisis” which means “movement”).
Pharmacokinetic data is needed in drug development for safety assessment and dosage optimization to guide the design of new therapies. To ensure that new medication is safe and effective, rigorous testing and evaluation are conducted during the drug development process.
When evaluating a drug’s performance and potential risks, preclinical studies and clinical trials provide information about the drug’s safety, efficacy, and pharmacokinetic profile. Drug evaluation is based on understanding how a drug interacts with the body and the parameters of that interaction.
As stated in Biochemical Pharmacology, “Pharmacokinetics (PK) is the study of the time course of the absorption, distribution, metabolism and excretion (ADME) of a drug, compound or new chemical entity (NCE) after its administration to the body.”
In other words, pharmacokinetics focuses on the dynamics of the processes related to transformations that occur within the body over time after drug administration. The time component of these processes supports the need for timelines to aid in their interpretation.
Timeline modeling can be used in measuring and comparing PK parameters. It can also improve the clarity of data presentation and support a more accurate interpretation of the data. Not to mention that it can make a compelling argument in the documentation submitted for regulatory approval.
We will first briefly cover the basics of pharmacokinetics, its processes, and applications in simple terms.
Pharmacology, pharmacokinetics and pharmacodynamics basics
Pharmacology, pharmacokinetics and pharmacodynamics are interconnected. The way they relate with each other provides a perspective on why they form the foundation for drug development, which is based on how medications work and how they can be used to get optimal therapeutic results.
Pharmacology is the branch of medicine and biology that focuses on medications and their effects on living organisms, how they work, how the body responds to them, and the changes that occur over time.
Pharmacokinetics (PK) is a branch of pharmacology concerned with the way the body processes medications throughout the entire duration of exposure, from the moment a drug is absorbed, to how it is distributed, metabolized, and excreted - in simple terms, how a drug is handled by the body. Pharmacokinetics is closely related, but distinct from pharmacodynamics (PD), which examines the effects of medicines on the body.
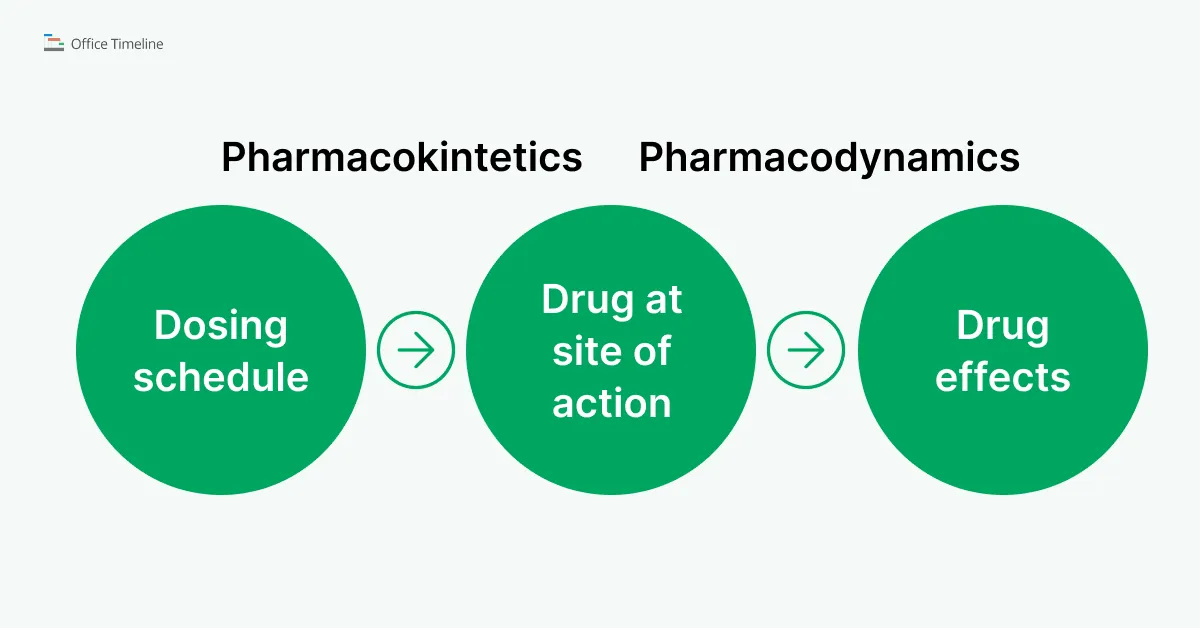
In very simple lines, this is how pharmacokinetics and pharmacodynamics are related:
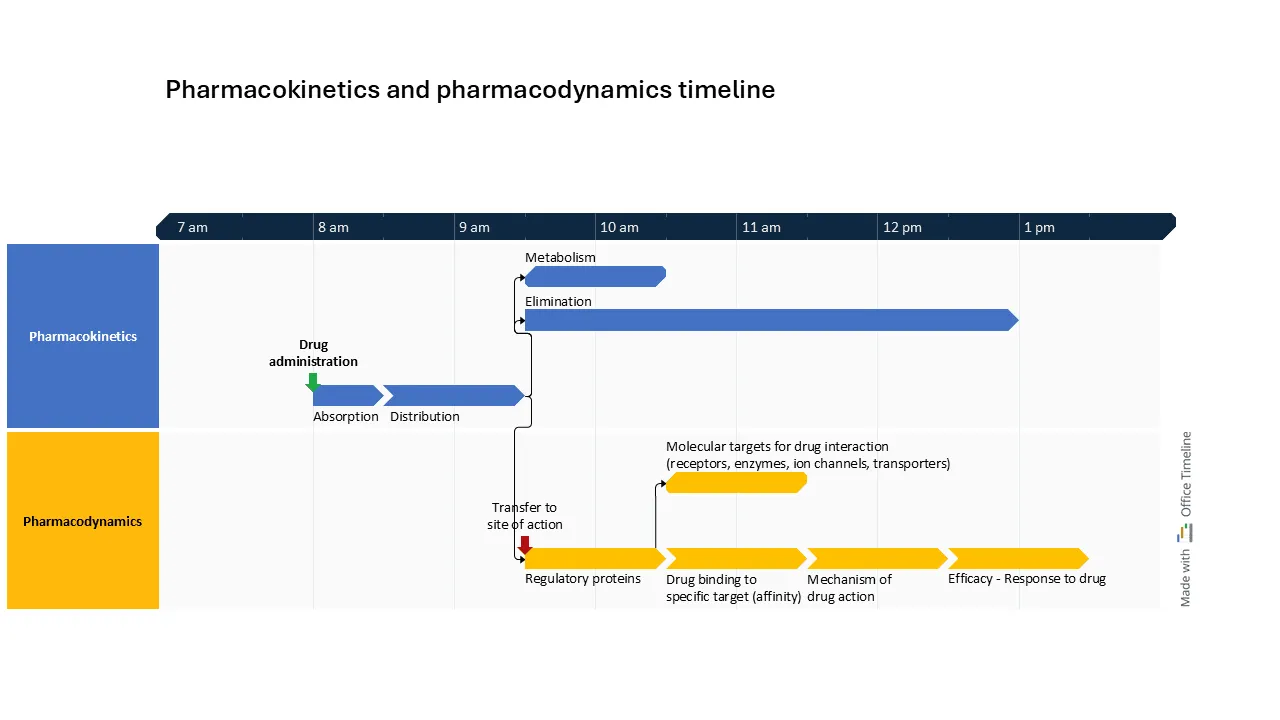
Comparatively, the timeline example below shows in a clear and detailed way the path of a drug from administration going through absorption and distribution, then continuing with metabolism and elimination (PK). At the same time, its transfer to the site of action can be observed, where the regulatory proteins engage with molecular targets and trigger the drug’s mechanism of action (PD).
This timeline provides a parallel view of the PK and PD dependencies, showing the coordinated progression from drug administration to its therapeutic effects:
ADME processes in pharmacokinetics
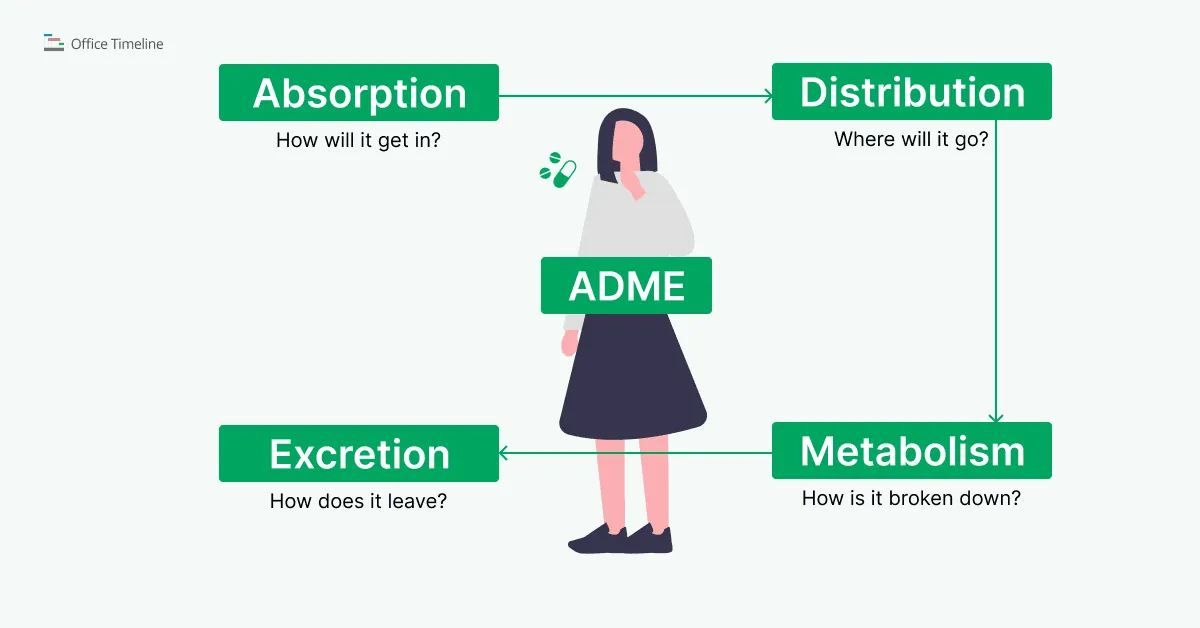
Pharmacokinetics studies the way drugs are processed over time in biological systems, passing through four phases: Absorption, Distribution, Metabolism, and Excretion, collectively known as ADME.
The data related to ADME processes helps researchers and healthcare professionals model pharmacokinetic profiles of medications and determine optimal dosages that produce the desired effects with minimal side effects.
ADME is relevant not only in pharmacology, drug development, and treatment planning, but also in toxicology, where it is used to evaluate the safety and potential hazards of various compounds, and in regulatory submissions, to demonstrate the safety and efficacy of new drugs.
ADME - Absorption, Distribution, Metabolism, Elimination
In drug development, a good understanding of pharmacokinetic parameters is relevant because it supports demonstrating that the drug performs as intended in the target population and is safe. The pharmacokinetic parameters include:
- the rate of absorption, which determines how quickly a drug enters the bloodstream and influences its onset of action;
- distribution, showing how the drug spreads throughout the body and targets specific tissues or organs;
- metabolism data, which detail the chemical transformation of the drug primarily in the liver, affecting its duration of action and potential interactions;
- excretion parameters, assessing how efficiently the drug and its metabolites are eliminated from the body, primarily through urine or feces.
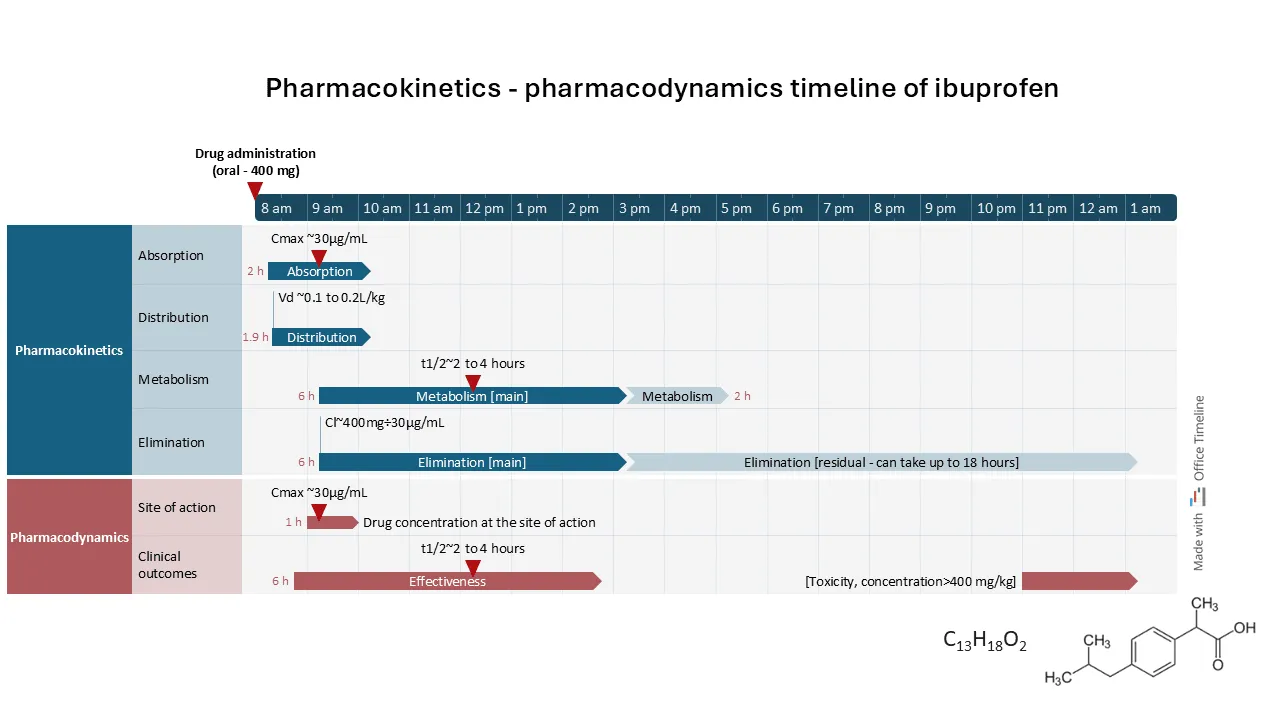
To illustrate these concepts, consider the example below: the pharmacokinetics timeline of ibuprofen (a common pain medication marketed as Advil, Motrin or Nurofen), supplemented by pharmacodynamics data for a more complete context. Following oral administration, ibuprofen is rapidly absorbed, reaching peak concentration typically within 1-2 hours.
This timeline effectively highlights the progression of the ADME processes (absorption, distribution, metabolism, and elimination) of ibuprofen over time:
The advantage of this timeline view is that it shows both PK and PD processes in parallel, marking key points such as drug maximum concentration (Cmax) and half-life (t1/2) as milestones in both sections. This layout offers a clear visual comparison of drug levels alongside therapeutic effects, making it easier to track concentration changes and their impact on efficacy. By aligning PK and PD data, this timeline can be a valuable tool in presenting complex drug kinetics and dynamics in a visually accessible way.
How does a correct interpretation of ADME influence treatment outcomes?
The main benefit of an in-depth understanding of the ADME processes is that it enables clinicians to predict how a medication behaves in the body. ADME data varies with patients’ physiology and lifestyles, so treatments need to be adjusted to maintain and reduce adverse effects.
For instance, understanding how quickly a drug is absorbed can guide dosage timing and serve as a basis for choosing the appropriate type of medication for a patient’s specific circumstances.
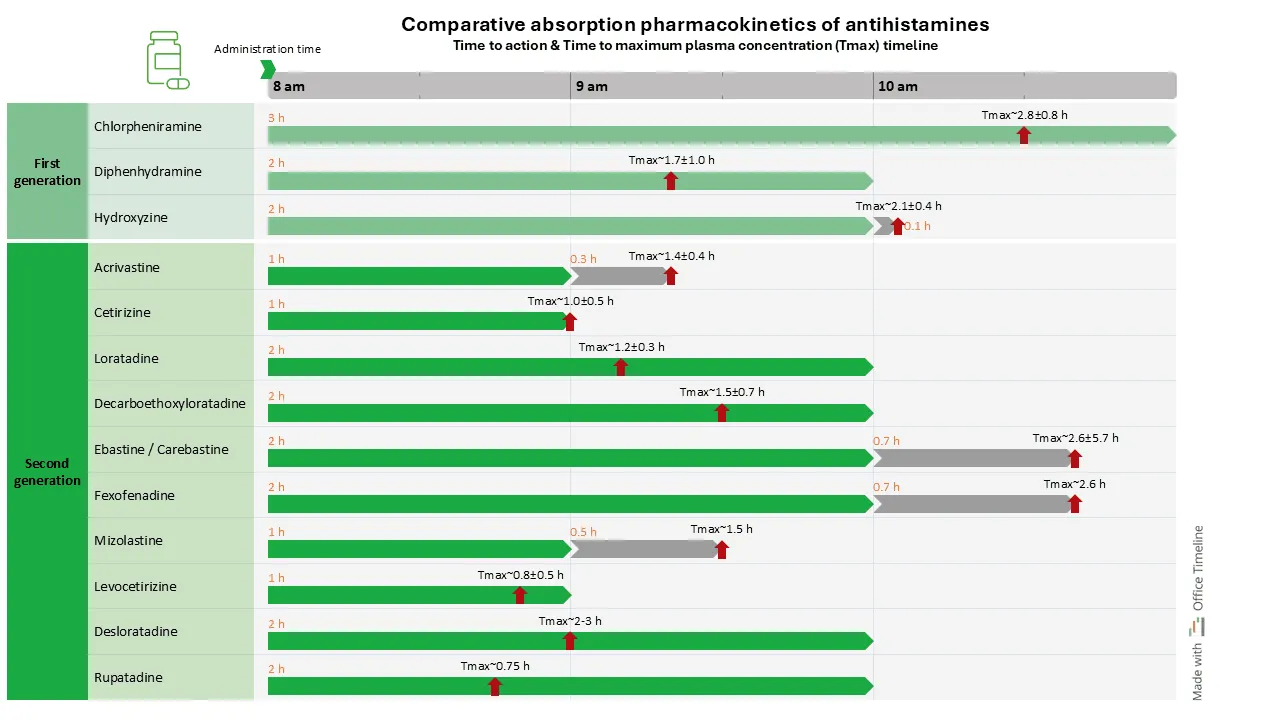
In the example below, comparing the absorption and Tmax (time to maximum plasma concentration) of antihistamines (anti-allergy medication) is relevant in scenarios where the speed of symptom relief is needed, such as in treating acute allergic reactions. If a patient needs rapid relief from serious symptoms, choosing an antihistamine with a shorter Tmax means faster onset of action and quicker symptom relief.
The advantage of this comparative timeline is that it visually demonstrates the pharmacokinetics (PK) of first-generation and second-generation antihistamines side by side and clarifies understanding of their pharmacokinetic profiles.
The timeline can help clinicians in optimizing treatment regimens based on individual symptoms and lifestyle requirements. It can also serve as an educational tool for patients and a basis for discussions about treatment options. By presenting data in an accessible format, the comparative timeline connects pharmacological information with its practical application.
Understanding a drug’s distribution can help predict and manage potential drug interactions. Information on drug distribution reveals where the drug accumulates in the body and how it interacts with other compounds. When multiple drugs are administered, knowing their distribution patterns helps in adjusting doses and timing to prevent adverse interactions.
For example, if two drugs compete for the same binding sites on plasma proteins or transporters, one may displace the other, this leading to higher concentrations of the unbound, active drug in the bloodstream. This can increase the risk of side effects or toxicity.
Knowledge of the metabolic pathways helps practitioners select the correct medications for patients with specific conditions or genetic traits that affect drug metabolism.
For instance, some patients may have genetic differences that slow down or speed up the activity of certain liver enzymes. This affects how quickly a drug is broken down (metabolized). In such cases, reduced efficacy or increased risk of side effects may occur. Information on the metabolic pathways of various drugs helps practitioners select drugs that are less likely to be affected by these variations or help them adjust dosing.
The thorough understanding of the specific ways a drug is eliminated from the body, along with information on its half-life, helps practitioners adjust dosages to maintain therapeutic effectiveness without causing harm, especially for patients with impaired organ function.
For example, in patients with reduced kidney function, the excretion of drugs that are primarily eliminated through the kidneys may be significantly slowed. This can lead to drug accumulation and increase the risk of toxicity.
Time-sensitive pharmacokinetic applications in drug management and regulatory processes
As mentioned, pharmacokinetics examines the temporal dynamics of a drug's absorption, distribution, metabolism, and excretion (ADME). Evaluating pharmacokinetic parameters is needed in assessing a drug's safety and efficacy, particularly in the contexts of drug management and regulatory approval processes.
Here’s how pharmacokinetics data influences the workflows that these processes require.
Drug development stage
In early research phases of the drug development process, pharmacokinetics and pharmacodynamics guide the process during preclinical studies that use animal models before advancing to human trials.
Animal models are considered the most important in vivo systems for gathering data on how a drug behaves within a living organism, predicting the ADME of the drug, which helps determine its basic pharmacokinetic parameters, such as efficacy, safety, and toxicity.
Insights from these studies help shape the drug's formulation and dosing strategies, and help transitioning to clinical trials. These preclinical data is necessary before transitioning to human trials.
Pharmacokinetic studies, which measure bioavailability and help in dose selection, are required before a drug can be marketed.
By analyzing the pharmacokinetic profiles, researchers can:
- determine doses that maintain the desired plasma concentrations while reducing the risk of toxicity – in other words, maximize therapeutic effects and ensure patient safety;
- determine the optimal route of administration (oral, intravenous, or another method) so that the drug can reach its target in the correct concentration.
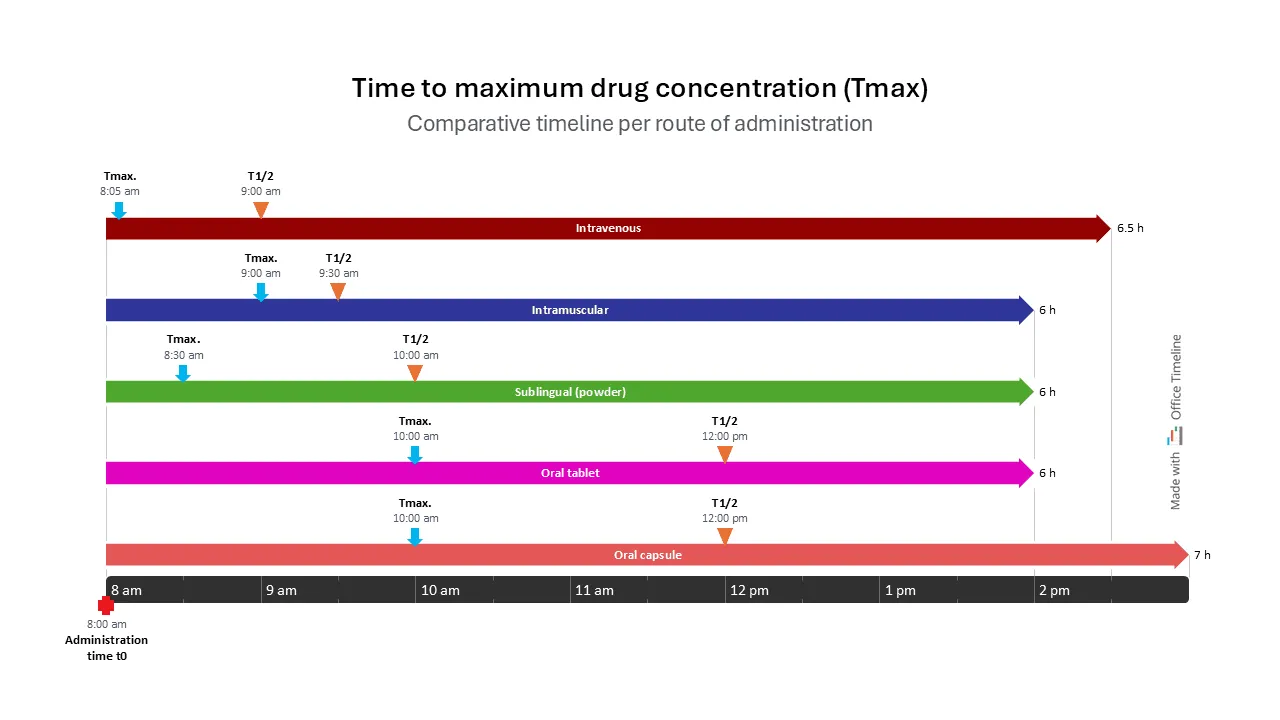
This timeline clearly shows the time to maximum drug concentration (tmax), comparing different routes of administration:
This comparative timeline shows Tmax and t1/2 for the same drug administered via different routes: IV, sublingually, oral tablet, and oral capsule. It demonstrates how the route of administration influences pharmacokinetic parameters and therapeutic outcomes.
For example, a drug administered intravenously (IV) reaches peak concentration shortly after administration, bypassing the absorption phase since it is directly introduced into the bloodstream. This scenario is consistent with the administration of medications for acute pain management, where rapid onset is critical. Similarly, in serious infections, antibiotics are often given IV to achieve immediate therapeutic levels.
In contrast, drugs taken orally reach maximum concentration only after a significant amount of time, being more fit for situations where a gradual effect is desired. For example, orally administered ibuprofen provides analgesic effects over time, making it suitable for chronic pain management rather than acute interventions.
Clinical trials
In clinical trials, pharmacokinetic data is collected to assess the safety and efficacy of new drugs.
During Phase I trials, researchers collect data to evaluate the drug's safety, tolerability, and pharmacokinetic profile in healthy volunteers. This early-phase data is required in the process of adjusting dosages and establishing appropriate study parameters for subsequent trial phases.
In this initial group, researchers determine how the drug is metabolized and excreted. This incipient data allows them to adjust dosing strategies and study protocols for subsequent testing phases.
As clinical trials progress to Phase II and III, the role of pharmacokinetics increases. In these later phases, PK data is used to evaluate the drug's performance within specific patient populations. This analysis helps understand the variability in drug responses, which can be influenced by factors such as age, sex, genetic predispositions, and existing health conditions.
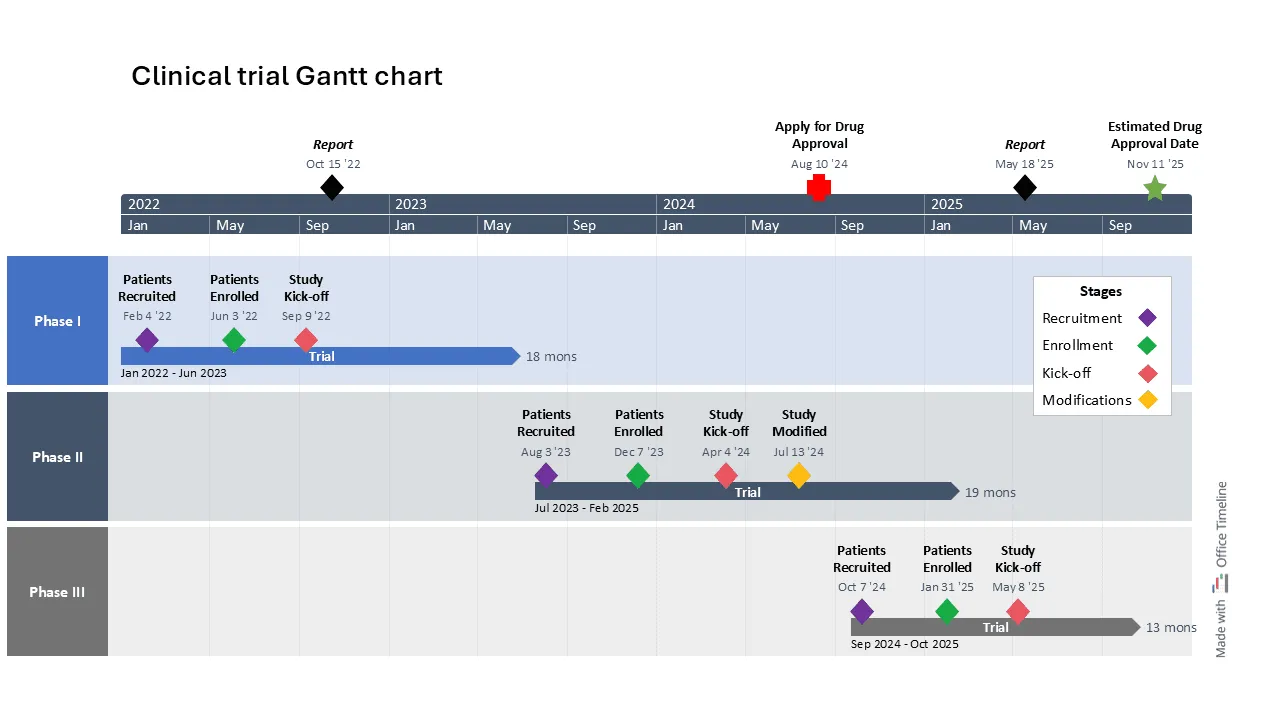
This timeline example provides a clear Gantt chart overview of the clinical trial phases for a new drug candidate, organized into distinct swimlanes representing each phase from patient recruitment to study kick-off.
It highlights key milestones and durations, using a dual timescale (years and months) for a comprehensive view of both short- and long-term goals. Color coding enhances clarity, while a legend box explains the significance of each color. Find more use cases in our article detailing top examples of timelines, Gantt charts, and roadmaps for the Pharma industry.
Regulatory submissions
Submitting a New Drug Application (NDA) to regulatory agencies (such as FDA or EMA) requires the inclusion of comprehensive pharmacokinetic data, among other information. This data is required to demonstrate that the drug can achieve therapeutic levels within the intended patient population with minimal risks of significant adverse effects.
For example, applications to FDA need to include bioavailability (drug absorption efficiency) and bioequivalence (therapeutic equivalence) proof, as the document Bioavailability and Bioequivalence Studies Submitted in NDAs or INDs specifies:
"Under FDA’s regulations, applicants must use the most accurate, sensitive, and reproducible method available to demonstrate BA (Bioavailability) or BE (Bioequivalence) of a product. […] Several in vivo and in vitro methods can be used to measure BA and to establish BE. These include, in general order of preference, pharmacokinetic (PK) studies, in vitro tests predictive of human in vivo BA (in vitro-in vivo correlation), pharmacodynamic (PD) studies, studies with clinical benefit endpoints, and other in vitro studies."
By providing a detailed analysis of the drug's ADME, sponsors offer regulators a clear understanding of how the drug performs in real-world scenarios. PK data is required also for the labelling information that accompanies a new drug, and that should include:
- Dosing recommendations and administration times specifications for potential interactions with other medications.
- Dosing adjustments or precautions that should be taken for special needs patients, like the case of people with renal or hepatic impairment or other pre-existing conditions that may be affected by the side effects of certain medications.
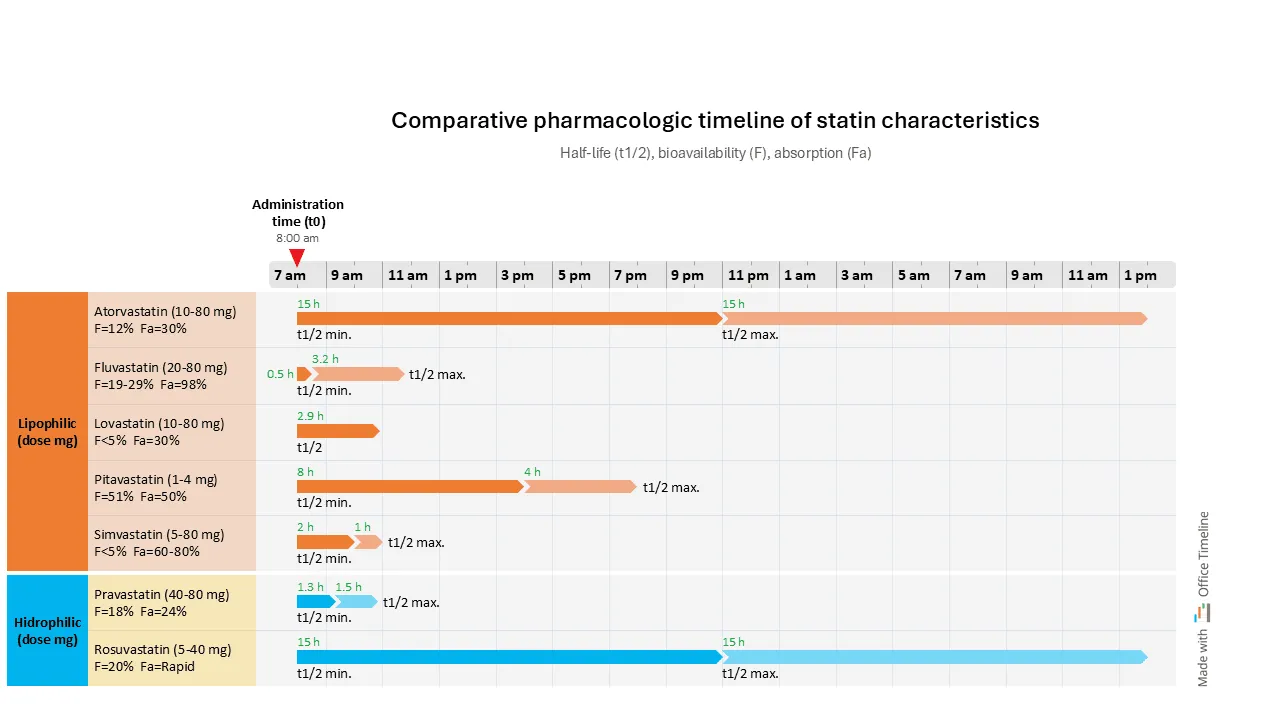
In the example below (based on Pharmacology 101: An Overview of Statins), we can see a classification of statins (medication aimed at lowering bad cholesterol) based on their solubility characteristics and other factors that could guide medication plans for patients with other conditions. Prescribing statins to these patients can raise concerns about potential side effects, but some options may be safer than others.
Organizing data in a Gantt chart format, with swimlanes for each statin type and a time scale that indicates the duration of action for each along with their minimum and maximum half-lives (t1/2), effectively highlights the differences between statins at a glance.
The chart also includes information about bioavailability and absorption parameters. This organized data presentation makes it easier to prepare for regulatory submissions by allowing for clear evaluations that regulatory bodies require.
Conclusion
Pharmacokinetics data and a precise understanding of ADME are part of the basis for developing effective and reliable therapies. An accurate understanding of the temporal dynamics of these processes is necessary for optimizing dosing and improving therapeutic outcomes.
To achieve this, timelines can help by clearly showing these time-dependent relationships. Researchers and clinicians can visualize in a better way the time component of drug biotransformation and how a drug's behavior changes over time.
This visual representation makes it easier to understand the data and emphasizes the role of timing in drug administration and response. The clear and structured presentation of data informs more accurate dose adjustments, scheduling, and efficacy evaluations throughout the stages of drug development.
About the pharmacokinetics timelines
In time-dependent environments like drug kinetics and dynamics, timelines can be useful tools that can help quickly show the sequence of key processes and present information clearly to any audience. You can use them to:
- track and visualize processes, from drug absorption and distribution to effects at the target site,
- highlight the timing of each process in relation to drug efficacy and patient response,
- track milestones and visualize dependencies.
These combined data, put in a crisp format, that makes the information easy to understand, can be useful for preparing submission documents, conference materials, for supporting clinical studies, and even as a practical tool to help with decisions around dosage, timing, and treatment planning.
The PowerPoint timelines in this article were crafted using the Office Timeline add-in, an easy-to-use tool designed to create detailed and clear visuals. Download them for free as editable PowerPoint slides and customize them as needed. To update and personalize the timelines, download the free 14-day trial of the Office Timeline add-in, which provides access to its most advanced features.
FAQs about pharmacokinetics parameters and measurements
PK concepts and measurements can often seem complex and technical. Whether you’re new to the field or looking for specific answers, these explanations aim to clarify some of the most common questions around basic pharmacokinetic concepts and parameters.
Pharmacokinetics (PK) is the branch of pharmacology that studies how drugs move through the body over time. It includes four primary processes: absorption, distribution, metabolism, and excretion, known as ADME. These processes determine how a drug is absorbed into the bloodstream, how it is distributed to various tissues, how it is metabolized (or broken down), and how it is excreted from the body. Pharmacokinetics provides important information for drug development, as it helps establish safe and efficient dosages by evaluating how the body affects a drug after administration.
The four stages of pharmacokinetics are absorption, distribution, metabolism, and excretion - often abbreviated as ADME. They describe how a drug moves through the body from administration to excretion:
Absorption
This is the process by which a drug enters the bloodstream after being administered. Absorption can vary depending on the route of administration (e.g., oral, intravenous, topical). It affects how quickly and how much of the drug reaches systemic circulation.
Distribution
After absorption, the drug is distributed throughout the body through bloodstream. During this stage, the drug travels to various tissues and organs. Distribution is influenced by factors like blood flow, tissue permeability, and the drug’s ability to bind to proteins within the blood.
Metabolism
In this stage, the body chemically alters the drug, usually in the liver, to make it easier to eliminate. This process often transforms the drug into more water-soluble metabolites which can be excreted more easily. Metabolites are the products formed when the body breaks down (metabolizes) the drug . Metabolism can either activate or deactivate the drug's therapeutic effects.
Excretion
The final stage is the elimination of the drug and its metabolites from the body, primarily through the kidneys (in urine) or the liver (in bile). Excretion determines how long the drug’s effects last in the body by removing the drug and its metabolites from the body. The faster the drug is excreted, the shorter its duration of action. Slower excretion means the drug stays in the body longer, extending its effects.
Pharmacodynamics refers to the effects a drug has on the body, for example, how it interacts with receptors or enzymes to produce its therapeutic effects. It focuses on the drug’s mechanism of action, efficacy, and potential side effects.
Pharmacokinetics studies how the body affects the drug over time. It includes the study of the ADME processes - absorption, distribution, metabolism, and excretion. It deals with how the drug moves through the body and how its concentration changes over time.
In layman’s terms:
Pharmacodynamics = What the drug does to the body.
Pharmacokinetics = What the body does to the drug.
To measure the timeline of a drug in the body, several measurements need to be taken using the following parameters:
Plasma concentration (Cp)
Plasma concentration refers to the measurement of the drug's concentration in the blood over time. Blood samples are taken at different times after drug administration to measure the concentration of the drug in the plasma. This helps determine the drug's absorption, distribution, and elimination patterns.
Half-life (t½)
The time it takes for the concentration of the drug in the bloodstream to reduce by half. It gives an idea of how long the drug stays active in the body.
Maximum concentration (Cmax)
The highest concentration of the drug in the plasma. It typically occurs at peak time (Tmax).
Time to reach maximum concentration (Tmax)
The time it takes for the drug to reach its maximum concentration in the bloodstream.
Area Under the Curve (AUC)
A calculation that represents the total drug exposure over time. It’s used to determine the bioavailability of the drug and its overall effectiveness.
Clearance (Cl)
The volume of plasma from which the drug is completely removed per unit of time. It helps assess how efficiently the body eliminates the drug.
Volume of distribution (Vd)
A theoretical volume that describes how the drug is distributed throughout the body’s tissues. It indicates how extensively a drug moves into various tissues compared to plasma.
These parameters are usually calculated through blood sampling over time and analyzed using pharmacokinetic models to understand how a drug behaves in the body.
Peak time in pharmacokinetics refers to the time after drug administration when the drug reaches its highest plasma concentration. This is when the drug's effect is typically most intense. Peak time is the main indicator of how quickly a drug is absorbed; slower absorption leads to a later peak time. The concentration is at its maximum before it starts to decrease through metabolism and excretion.
Peak time is important for understanding the timing of the drug’s therapeutic effects and potential side effects.
Time-dependent pharmacokinetics (TDPK) refers to changes in a drug’s pharmacokinetic properties over the dosing period, often due to repeated dosing. These changes can affect how the drug is absorbed, metabolized, or eliminated, impacting dosing adjustments.
The duration of action in pharmacokinetics is the period during which a drug maintains its therapeutic effect within the body. It begins when the drug concentration reaches the minimum effective level and ends when it drops below that level. The duration of action is influenced by factors like absorption rate, metabolism, and excretion, and it helps determine how frequently a drug needs to be administered to maintain its effectiveness.
Project management tips and tricks
Tagged With:
Examples by industryTurn project data into professional timelines
Get the advanced features of Office Timeline free for 14 days.
