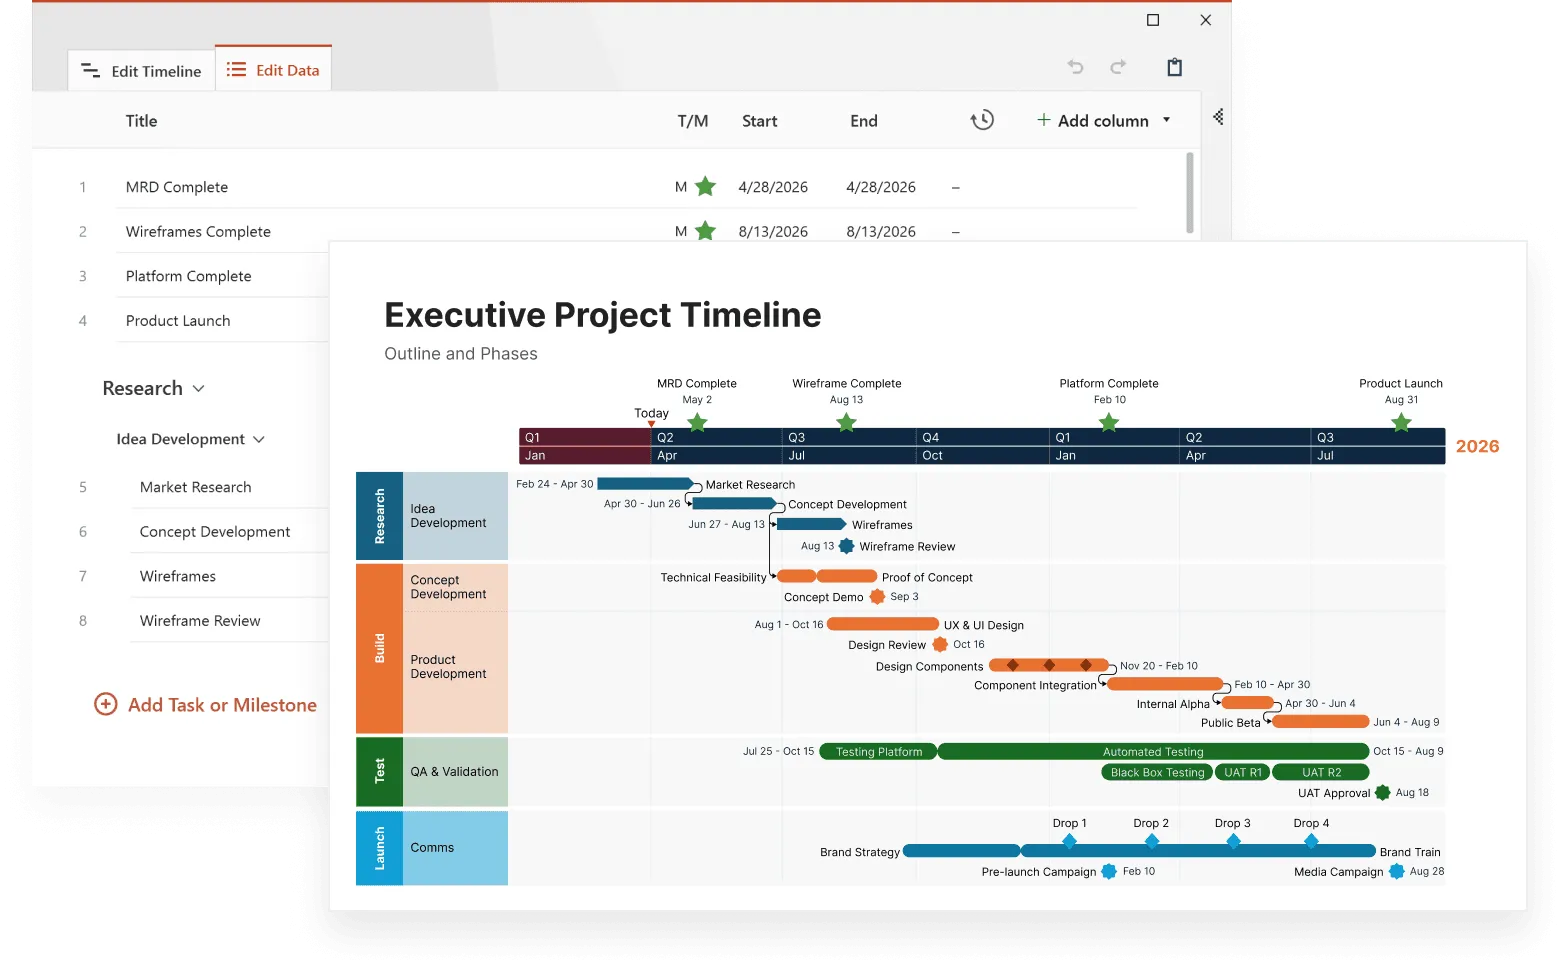
Gantt chart examples
Customers and executives want clear project visuals. Use these Gantt chart examples to make professional-looking presentations that draw attention and are easy to follow. Download and edit the samples manually in PowerPoint or use the Office Timeline Gantt chart maker to update them effortlessly.

Editable Gantt chart samples and project visuals for professionals
On this page, you will find a rich gallery of Gantt chart models for various use cases, including a simple Gantt chart example, a Gantt chart for Project Management, an IT project Gantt chart example, as well as a Gantt chart sample for project proposals.
Based on the long-standing Gantt chart frame, our collection of premade samples can accommodate both large and small projects, helping you save considerable time and effort.
Frequently asked questions about Gantt chart types and examples
A Gantt chart is a type of bar chart that visually communicates a project schedule. It displays the project’s underlying activities (tasks) and events (milestones) against a certain timeframe on a diagram with two axis. The horizontal axis represents the time scale set for the project, whereas the vertical axis shows the activities to be completed through a series of bars.
The position and length of each bar depends on the timeline and duration of its associated task (that is, the start date and end date of the activity in question). Due to this layout, a Gantt chart quickly communicates what work needs to be done and when.
To better understand what a Gantt chart looks like, browse our collection of Gantt chart examples provided here. Select the preferred model, download it as a PowerPoint file, and easily customize its setup to best fit your needs. Take these examples as a starting point and learn how to make Gantt charts in seconds to give your project a visual boost.
If you need more ideas, check out our extensive library of Gantt chart templates full of professionally-designed Gantt charts for different types of projects or industries.
Start making Gantt charts
Office Timeline is a free Gantt chart tool that lets you update these Gantt examples or build your own in seconds. Create stylish visuals in PowerPoint with the Office Timeline add-in or right in your browser with the Gantt chart maker's web version.


